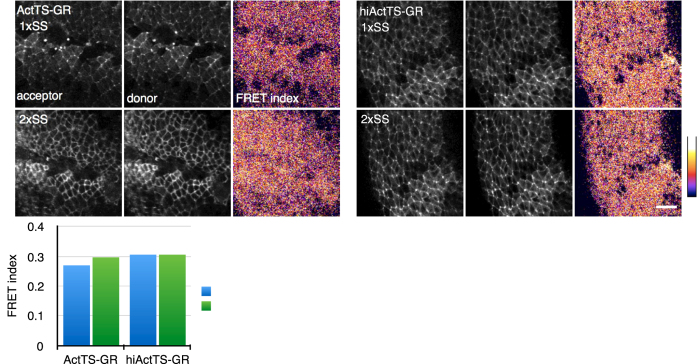
Figure 3. FRET efficiencies under different osmotic pressure.
(a,b) Images of Xenopus ectoderm expressing ActTS-GR (a) or hiActTS-GR (b) in 1 × SS (upper) or 2 × SS (lower). Left: acceptor image. Center: donor image. Right: corrected FRET index image. (c) Quantification of FRET index of ectoderm under different osmotic pressures. Values are average ± SD, n > 4. Scale bar = 50 μm. *p < 0.05.

