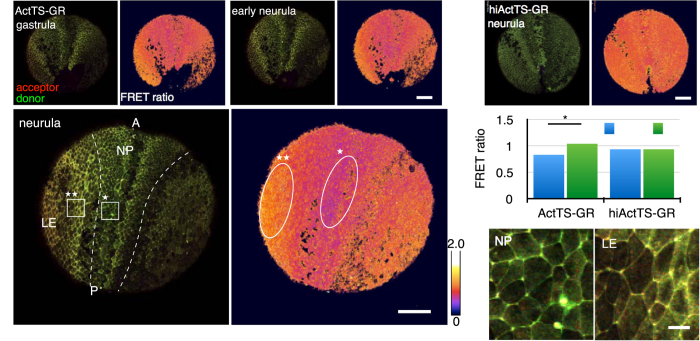
Figure 4. Tension on ectoderm and cells behavior during morphogenesis.
(a) Time-lapse images of an embryo expressing ActTS-GR at gastrula, early neurula, and neurula stage (left), and its FRET ratio images (right). Vegetal view. Dashed line delineates the closing posterior neural plate (NP) and the lateral epidermis (LE). A: anterior. P: posterior. (b) Image of an embryo expressing hiActTS-GR at neurula stage (left) and its FRET ratio image (right). (c) Quantification of the FRET ratio in NP (oval with * in a) and LE (oval with ** in a) at the neurula stage. Values are average ± SD, n > 5. (d) Amplified image of NP (rectangle with * in a), and LE (rectangle with ** in a). Scale bars = 200 μm in a, b, 20 μm in d. *p < 0.05.

