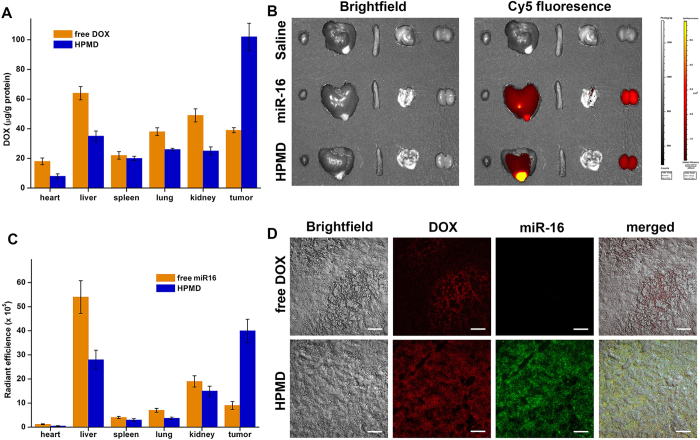
Figure 4. In vivo distribution of DOX delivered by HPMD.
(A) DOX concentration in different organs from mice administered with HPMD or free DOX; n ≥ 7, the values are presented as mean ± SEM. (B) Fluorescence of Cy5-labeled miR-16 administered as part of HPMD or free miR-16 and (C) the quantified radiant efficiencies imaged and analyzed by an IVIS Lumina XR system; the values are presented as mean ± SEM. (D) Confocal analysis of fluorescence-labeled miR-16 and DOX in tumor tissues.

