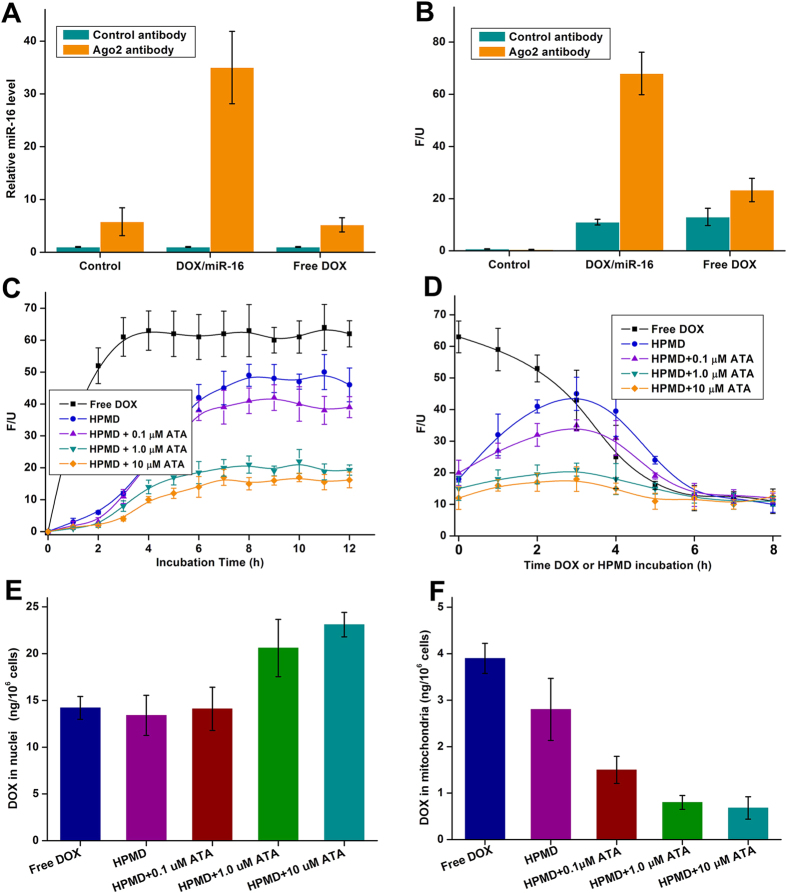
Figure 5. Test of ATA/HPMD in HepG2 cells.
(A,B) Measurement of the levels of (A) miR-16 and (B) DOX bound to RISC which was pulled down with an Ago2 antibody from cells treated with free DOX or HPMD. (C,D) Fluorescent intensity of DOX in (C) cells treated with ATA/HPMD or free DOX for 12 hours and (D) cells treated with ATA/HPMD or free DOX for 4 hours and then DOX-free ATA media for another 4 hours. (E,F) The DOX concentrations in (E) the nuclei and (F) mitochondria of cells treated with ATA/HPMD or free DOX for 12 hours. The values are presented as mean of 3 independent experiments ± SEM.

