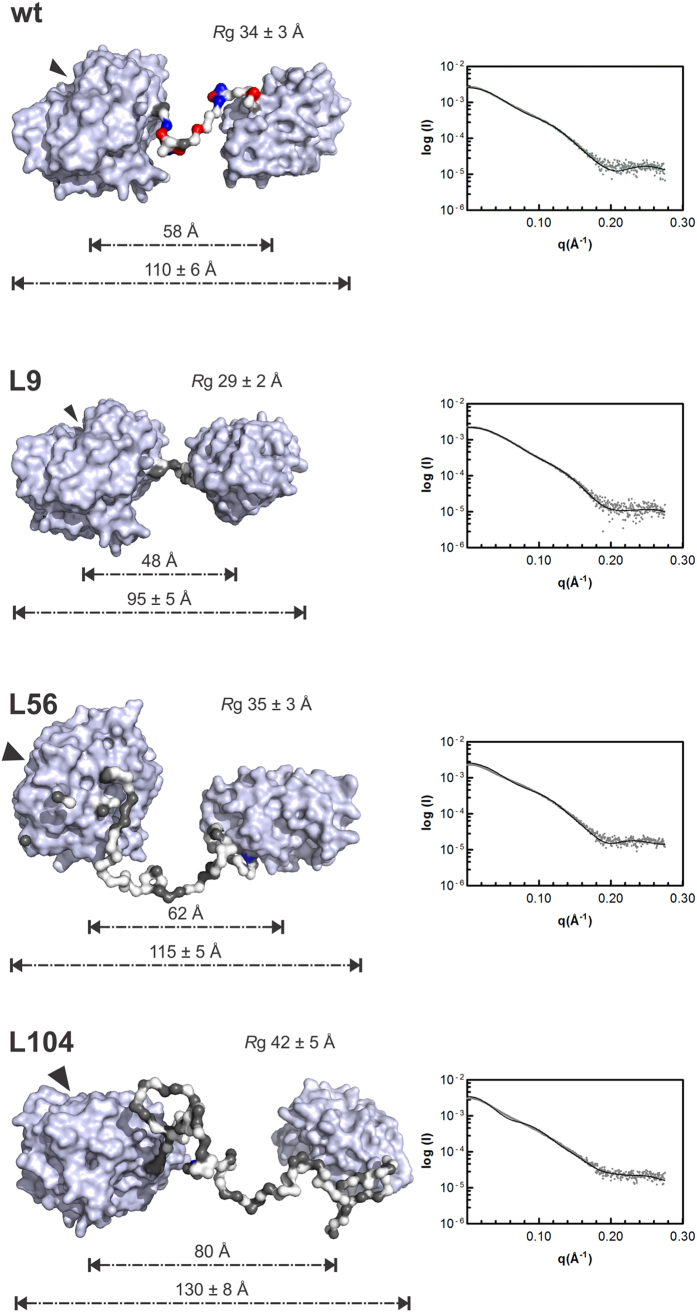
Figure 6. Molecular rearrangements induced by changes in linker length.
Representative models of the best set of conformers from EOM (left panels). The domains are represented as gray surfaces, and the linker residues are colored according to charge: positive (blue), negative (red) or hydrophobic (gray). The black arrows indicate the location of the catalytic cleft. Fit of the experimental scattering curve (dots) and average scattering curve (line) calculated from the best models using the CRYSOL program (right panels).

