
Figure 1. The characteristics of total salivary α-synuclein in PD group.
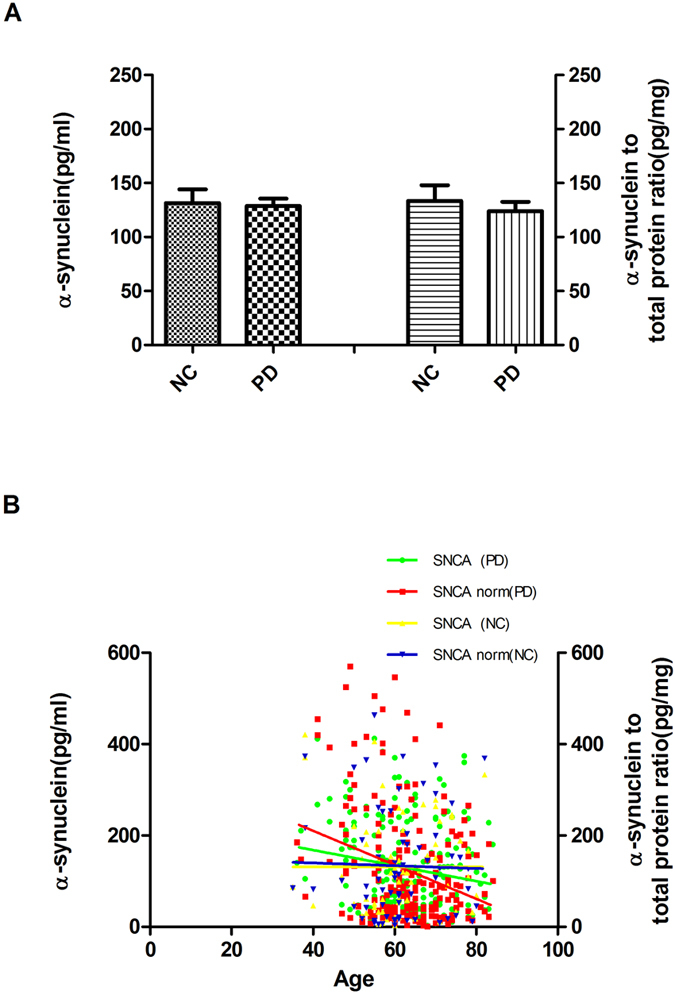
(A) Salivary α-synuclein levels were measured in individual normal controls (NC) and PD samples by Luminex. Quantitative Luminex analysis of salivary α-synuclein levels in patients with PD and NC, before and after controlling for potential contributions secondary to outliers (e.g. age, gender) by the nonparametric Mann-Whitney U test (for pair wise comparisons) and the covariance (ANCOVA) model analysis. There was no significant difference in mean salivary α-synuclein levels between cases and controls (p = 0.97), also no significant differences were found when normalized (p = 0.49). (B) Using linear regression analysis with spearman’s correlation, levels of α-synuclein in saliva tended to decrease with age in PD group (r = −0.16 p = 0.02, r = −0.21, p = 0.003 when normalized) but not in controls (p > 0.05; p > 0.05 when normalized). Error bars represent mean ± SEM.