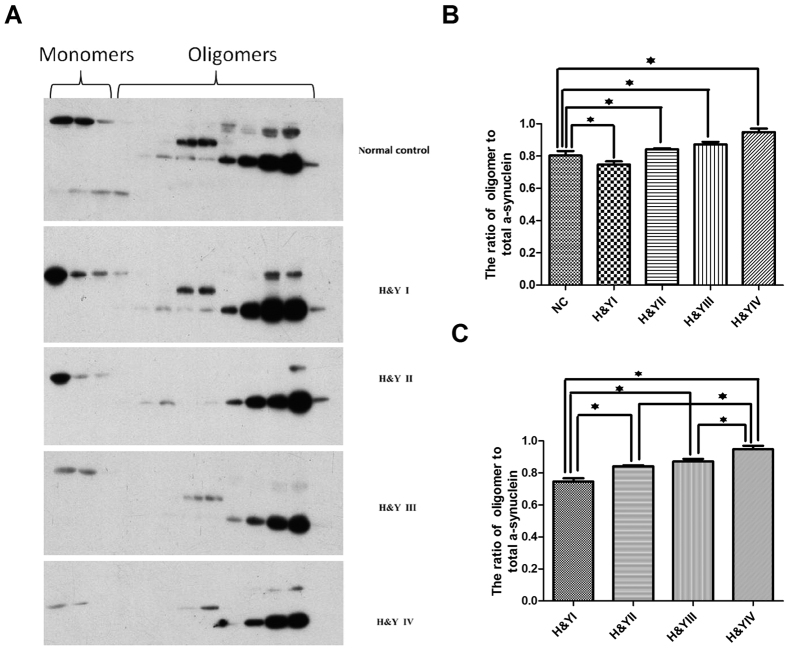
Figure 3. The diagnostic value of salivary oligomeric α-synuclein in PD.
Salivary proteins were analyzed by high-performance liquid chromatography on a Superdex75 (GE Health Care, USA) column that had been equilibrated with a solution containing 50 mM NH4HCO3 (pH = 7.4). Proteins were eluted from the column with the equilibration solution and the resulting fractions were subjected to immunoblotting analysis with antibodies to α-synuclein. All the gels have been run under the same experimental conditions and the representative cropped gels were shown in the figure.The positions of monomers, oligomers of α-synuclein are shown (Fig. 3A). From the analysis by Image J, the ratio of oligomer/total α-synuclein decreased significantly in H&Y stage I (p = 0.001) and increased in H&Y II-IV stages compared to normal controls (p = 0.037, p = 0.002, p = 0.000, respectively, Fig. 3B). The results also revealed significant differences at each H&Y stage (74.7%, 84.2%, 87.2%, 94.8%, respectively, p = 0.000, Fig. 3C). An analysis of covariance (ANCOVA) model was used.Error bars represent mean ± SD from 3 independent experiments.

