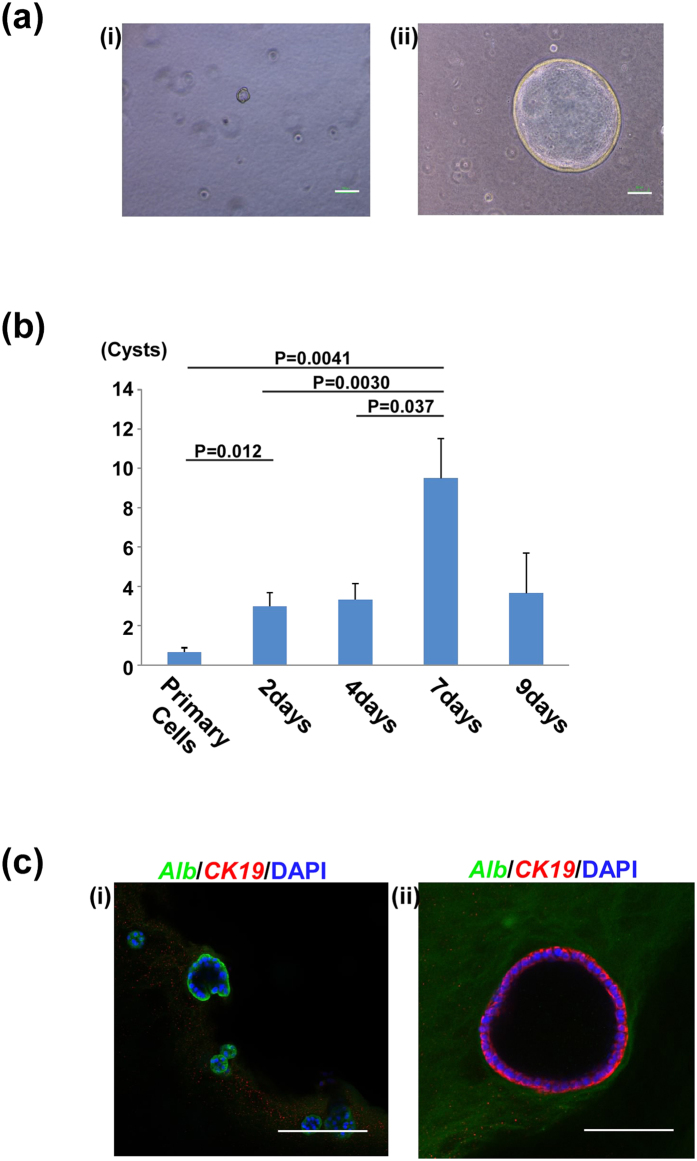
Figure 2. Cyst formation of murine liver progenitor cells.
(a) Representative images of cysts after 12 days of gel culture. Scale bars, 100 μm. (i) Cyst derived from primary cells. (ii) Cyst derived from cultured cells. (b) The number of formed cysts affected the duration of 2D pre-culture. Primary cells were cultured for 2 to 7 days on gelatine-coated dishes. These cultured cells were seeded into matrix gels and the number of cysts was counted. Results are presented as mean ± SEM. Statistical analysis was performed with Student’s t-test (n = 5). (c) Confocal microscopic images of cysts derived from foetal LPCs. Cysts were stained with anti-ALBUMIN (green) and anti-CK19 (red). Nuclei were stained with DAPI (blue). (i) Cyst derived from primary cells exhibited ALBUMIN+CK19− (ii) Cyst derived from cultured cells exhibited ALBUMIN−CK19+. Scale bars, 100 μm.

