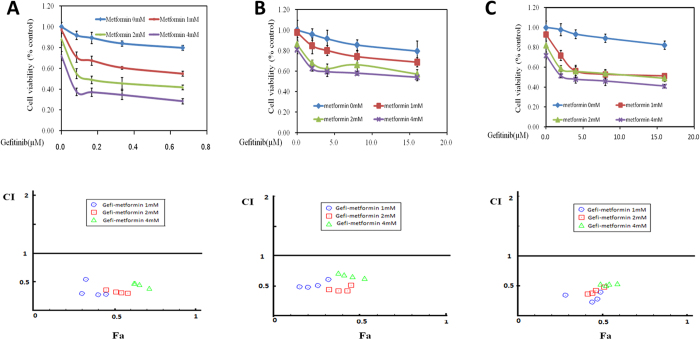
Figure 1. Treatment with gefitinib alone or combined with metformin on cell proliferation of 3 bladder cancer cell lines.
(A) Gefitinib combined with metformin inhibited MB49 proliferation synergistically. Above: Cell viability was assessed with 48 hour gefitinib at 0, 82.5, 165, 330, 660 nM alone or gefitinib combined with various concentrations (1, 2, 4 mM) of metformin treatment. Below: Combination index (CI) among the combinations of two drugs were calculated using CompuSyn software. If CI = 1, it denotes additivity; if CI > 1, it denotes antagonism; if CI < 1, it denotes synergism. CI values in the vast majority of combinations were less than 0.5, indicating moderately strong synergism. (B,C) Gefitinib combined with metformin inhibited T24 and UMUC3 proliferation synergistically. Above: Cell viability was assessed with 48 hour gefitinib at 0, 2, 4, 8, 16 μM alone or gefitinib combined with various concentrations (1, 2, 4 mM) of metformin treatment in T24 and UMUC3, respectively. Below: Combination index (CI) among the combinations of two drugs were calculated using CompuSyn software. If CI = 1, it denotes additivity; if CI > 1, it denotes antagonism; if CI < 1, it denotes synergism. Results are presented as the median of 5 independent experiments.

