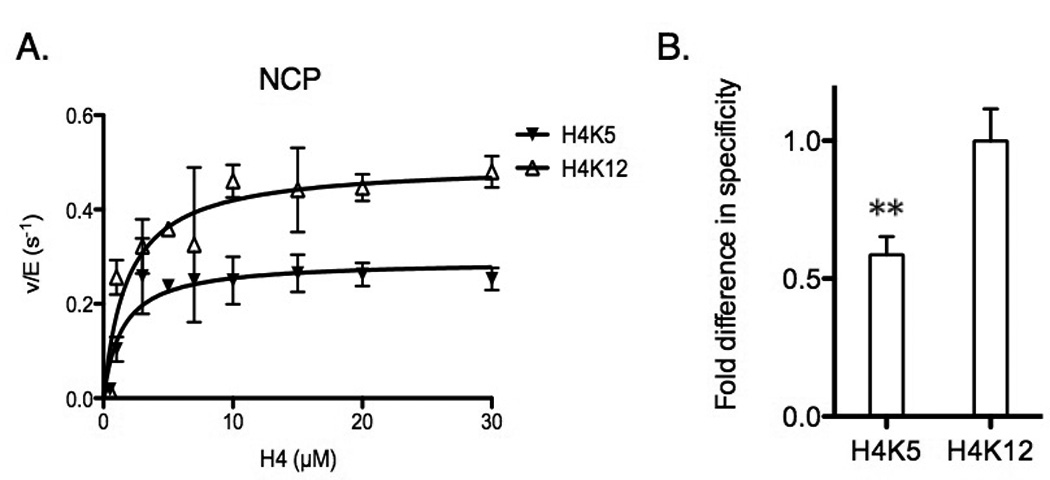
Figure 3.

Specificity comparison between lysine residues in NCP. (A) Determination of steady-state parameters for individual lysines (H4K5 and H4K12) of NCP acetylation catalyzed by Piccolo NuA4 in the presence of saturating acetyl-CoA. The error bar represents the standard error of v/E. The apparent kinetic parameters are summarized in Table 2. (B) The fold difference in specificity is determined by the ratio of kcat(app), and each site is normalized to the highest kcat(app) of H4K12. ** p < 0.01 when compared to H4K12. The error bar represents the standard error of specificity measurements.
