Figure 1.
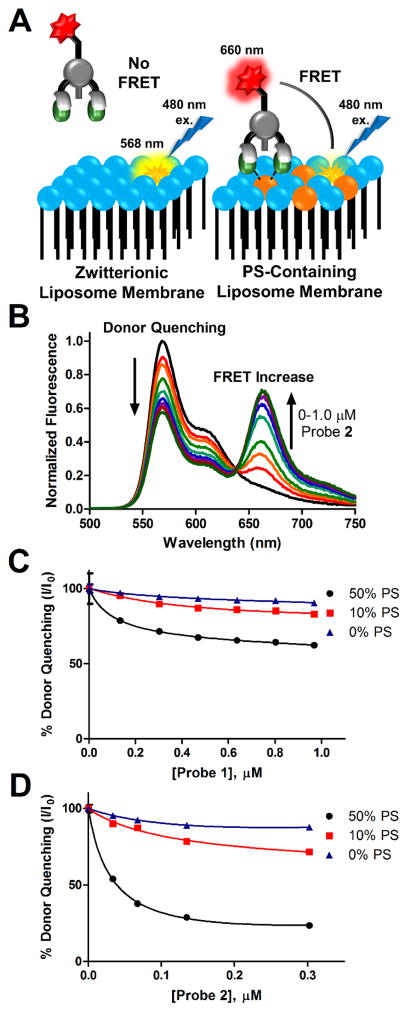
Probe membrane association measurements using a Fluorescence Resonance Energy Transfer (FRET) assay. (A) Schematic for FRET membrane association assay. Lipid coloring is consistent with legend in Scheme 1C. (B) Example fluorescence spectrum showing FRET response (λex 480 nm) upon addition of 2 to liposomes (10 μM total lipid) composed of 10% POPS (10:2:87:1 POPS:PEG2000DPPE:POPC:DiIC18). Lower graphs show fluorescence quenching of DiIC18 emission at 568 nm after titration of probe 1 (C) and 2 (D) as FRET acceptors associate with liposomes of varying PS content. All experiments were performed in HEPES buffer (10 mM, 137 mM NaCl, 3.2 mM KCl, pH 7.4) at 25°C. Error bars show standard deviation of the mean from three measurements and for most points on the graphs the errors bars are smaller than the symbols.

