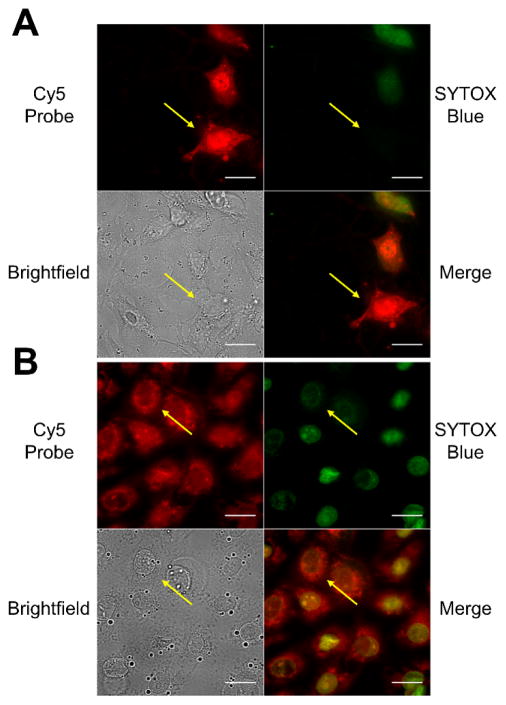
Figure 5.
Fluorescence micrographs of dead and dying CHO-K1 cells stained with 1 μM nucleic acid stain SYTOX Blue and 5 μM of either 1 (A) or 2 (B). The yellow arrows point to a cell in each field of view that is apoptotic. Intense green fluorescence indicates necrotic/late apoptotic cells. (Cy5 = red; SYTOX Blue = green; Bright field = gray). The cells were treated with camptothecin (15 μM) for 18 hr, then incubated with 5 μM of either probe for 15 min and washed with HEPES buffer. Scale bar = 25 μm.

