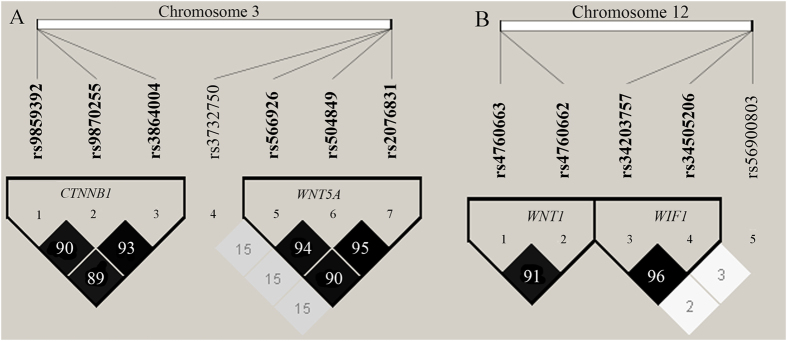
Figure 1. Linkage disequilibrium (LD) plots of SNPs.
(A) LD results of SNPs in the CTNNB1 and WNT5A genes on chromosome 3. (B) LD results of SNPs in the WNT1 and WIF1 genes on chromosome 12. Notes: Pairwise r2 values for all pairs of SNPs are presented as percentages in diamonds, and shading from white to black indicates the intensity of r2 from 0 to 1. Strong LD is represented by a high percentage (>80) and a darker square.

