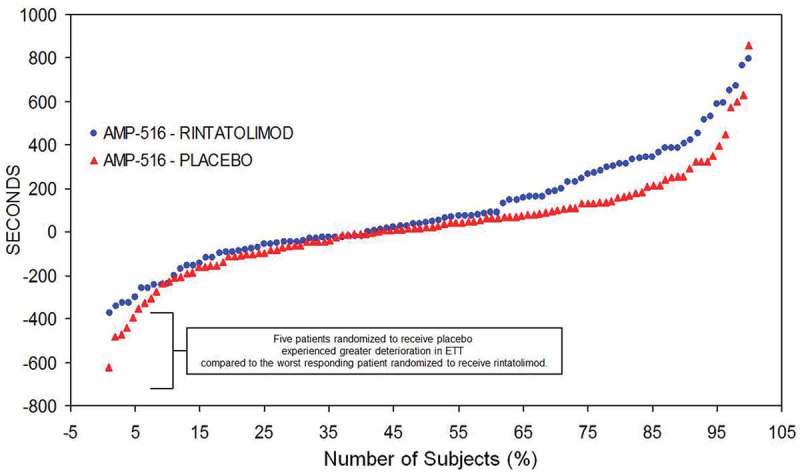
Figure 5.

AMP-516 plot of ET difference from baseline in seconds at 40 weeks treatment (ordinate) per each patient (abscissa). Plot of ET difference from baseline in seconds at 40 weeks treatment (ordinate) per each patient (abscissa). Reproduced from Strayer et al. Chronic Fatigue Syndrome/ Myalgic Encephalomyelitis (CFS/ME): Characteristics of responders to Rintatolimod. J Drug Res Dev 2015;1: doi http://dx.doiorg/10.16966/jdrd.103.
