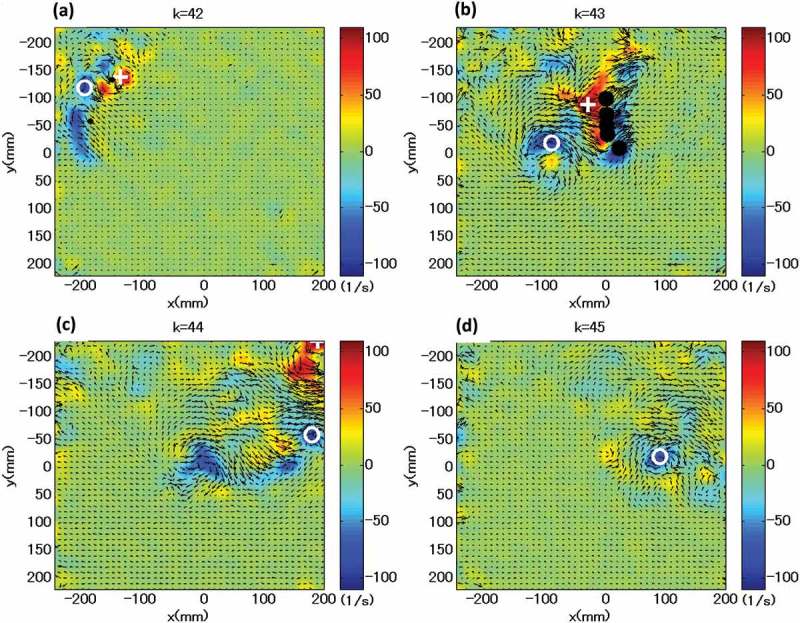
Figure 3.

Sequential variations of the velocity field at 70 ms intervals ((a) → (b) → (c) → (d)) for a trained swimmer. The flume speed was set at 1.2 m · s–1. The colour beside the velocity field represents the strength of the vorticity, measured in units of 1 s–1. The five filled circles in (b) correspond to the fingers. The strongest vortex pair is visible in panel (b). The maximum and minimum vortices are 135.3 s–1 (+) and −108.1 s–1 (○), respectively (Matsuuchi et al., 2009).
