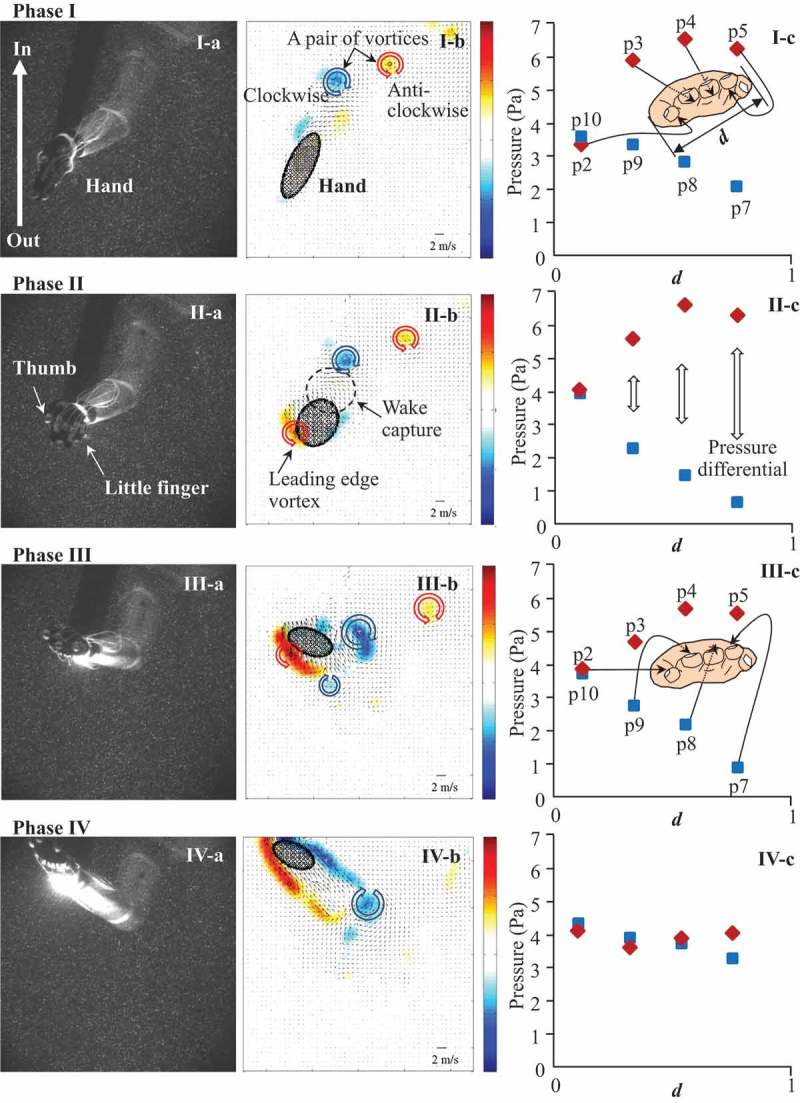
Figure 4.

Still images of hand (column a), computer-generated maps of vorticity and velocity (column b) and pressure distribution around the hand (column c) at each of the four critical phases (rows I–IV) in sculling. The still images were recorded looking up from below the bottom of the controlled-flow water channel, and the hand is moving from a swimmer’s side towards the centre line of body. In the maps of vorticity and velocity, the colour bars at the right indicate the direction and strength of the vortex: red and blue indicate counterclockwise and clockwise, respectively, and colour intensity relates to vorticity strength. The small arrows indicate the velocity of the flow field. For the graphs of pressure distribution (column c), the horizontal axes indicate the sensor’s position normalised to the width of the hand (d). The vertical axes indicate the pressure values detected by each sensor (p1–p12). Sensors p2, p3, p4 and p5 were attached to the palm side of the fifth, fourth, third and second fingers, respectively. Sensors, p7, p8, p9 and p10 were attached to the dorsal side of the second, third, fourth and fifth fingers, respectively (Takagi et al., 2014b).
