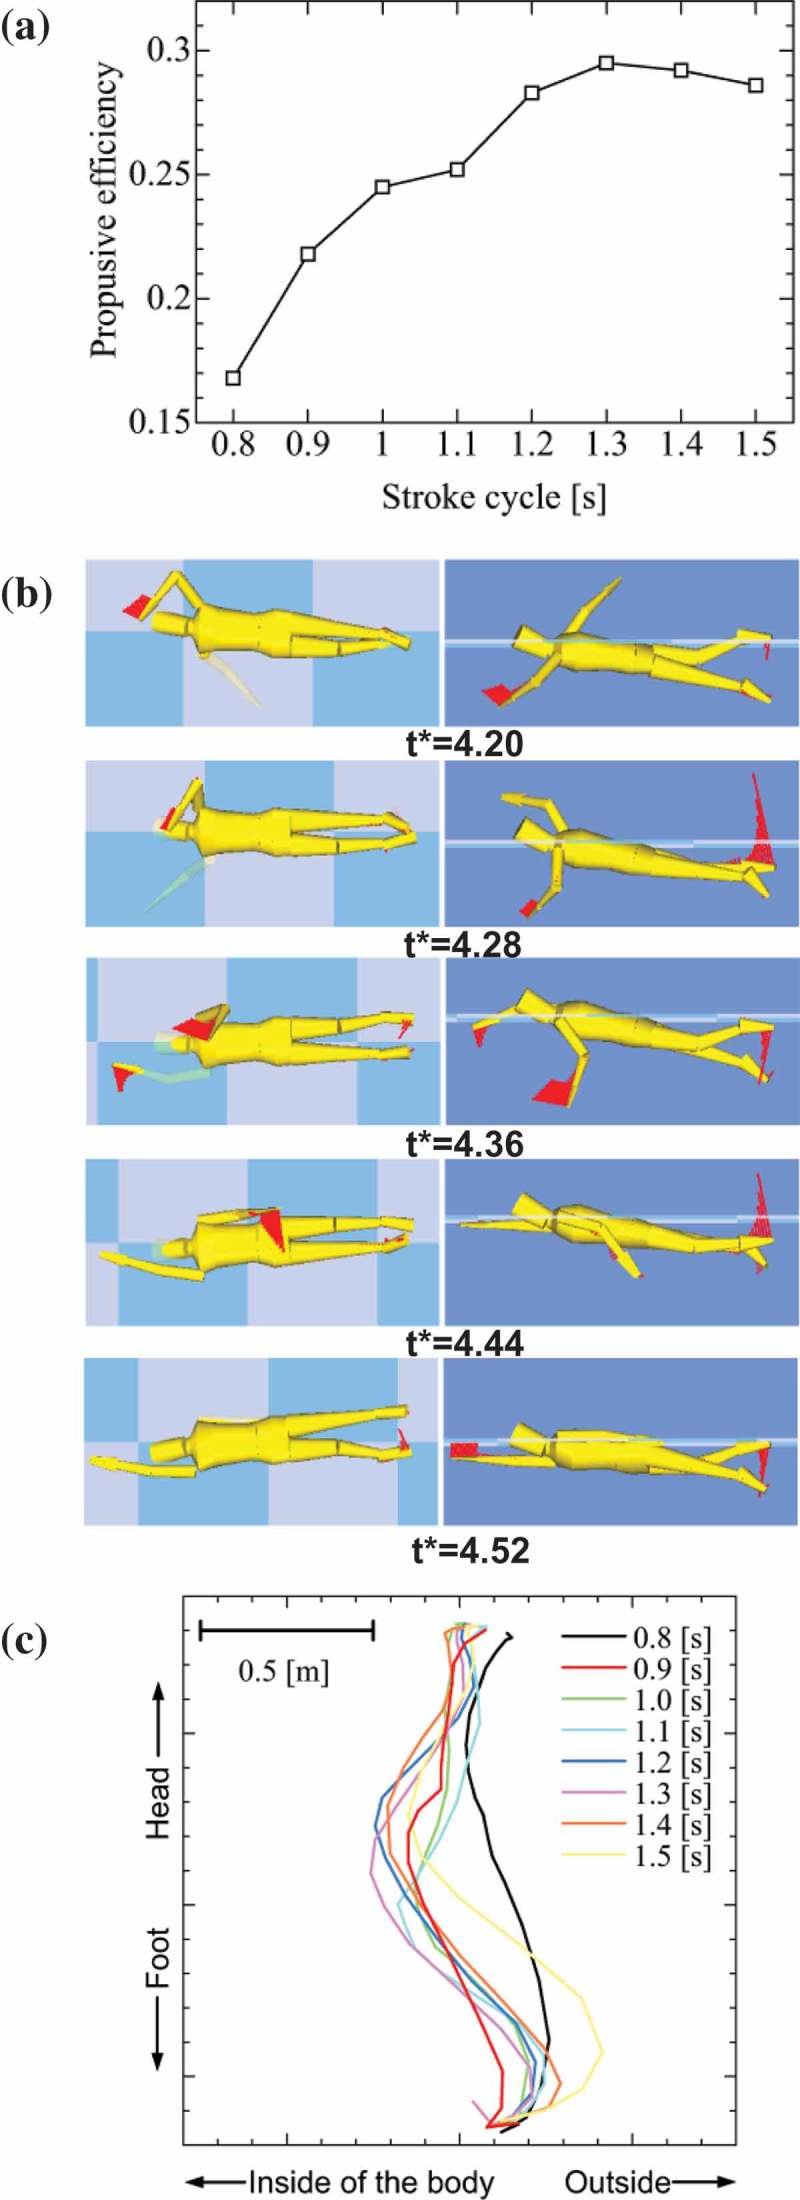
Figure 10.

Results of optimisation calculation by using SWUM. (a) Relationship between stroke cycle time (T) and propulsive efficiency; (b) bottom view (left) and side view (right) of swimming motions at maximising propulsive efficiency (T = 1.3 s); and (c) loci of left hand tip for various stroke cycles at maximising swimming velocity while the stroke cycle time (T) varied from 0.8 to 1.3 s (Nakashima et al., 2012).
