
Figure 4.
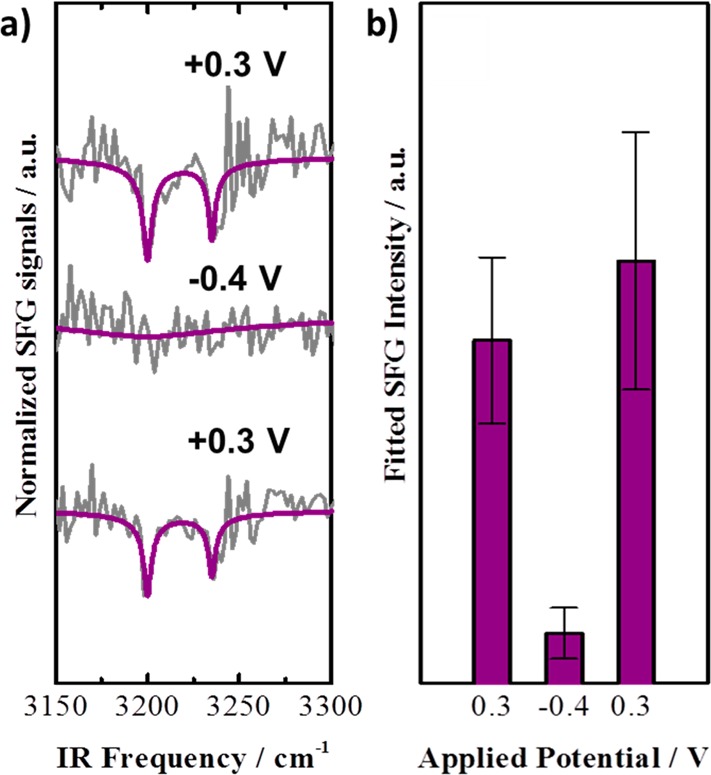
(a) Normalized and baseline corrected SFG spectra of the biotin-4KC:TEGT SAM (gray lines) and their corresponding fits (purple lines) for +0.3 V, −0.4 V, and returning to +0.3 V. (b) Sum of the fitted resonant SFG intensity at switching surface potentials. Reproduced from ref (15). Copyright 2014 The Authors. Published by WILEY-VCH Verlag GmbH & Co.