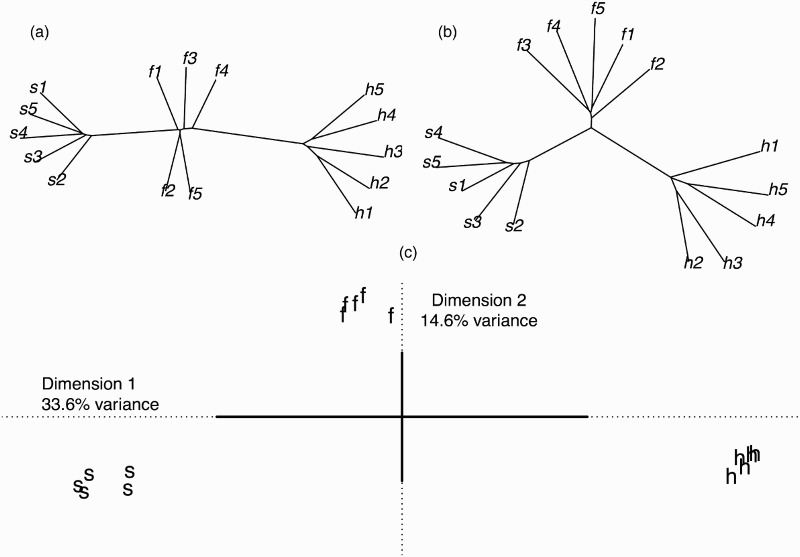
Figure 2.

(a) Cluster analysis based on MFCC of the stimuli. (b) Cluster analysis based on delta coefficients of the stimuli. Both cluster analyses used the Neighbor-Joining Tree algorithm (Mielke, 2012; Saito and Nei, 1987). (c) Stimuli projected onto the first two dimensions of the compromise between the two distance matrices (Abdi et al., 2012). The first dimension clearly separates the segments [s], [f] and [h] along its axis in three small clusters, whereas the second dimension further separates the [s] and [h] clusters from the [f] cluster.
