Fig. 6.

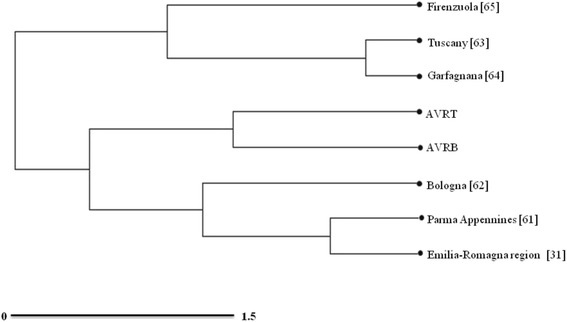
Hierarchical tree representing the relationships between the different analyzed sources based on the frequency of ingredients, according to Ward’s minimum variance criterion

Hierarchical tree representing the relationships between the different analyzed sources based on the frequency of ingredients, according to Ward’s minimum variance criterion