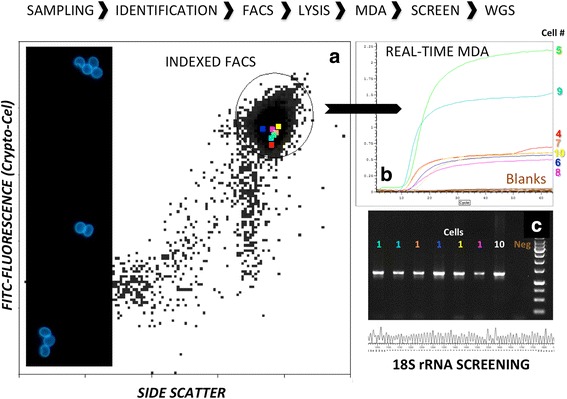
Fig. 1.

Conceptual graph of single cell genomics workflow applied to Cryptosporidium parvum. a Scattergram of side scatter and antigen-based fluorescence used for sorting individual cells. The gate for sorting is indicated by a circle and individual analyzed cells are marked by color. Panel with antibody stained oocysts to the left. b. Real-time MDA kinetics for individual amplified genomes color coded as in (a). Blanks are given in brown. c Small subunit rRNAscreening of amplified cells with gel electrophoreses and sequencing. Negative control and positive control with 10 cells are included for comparison
