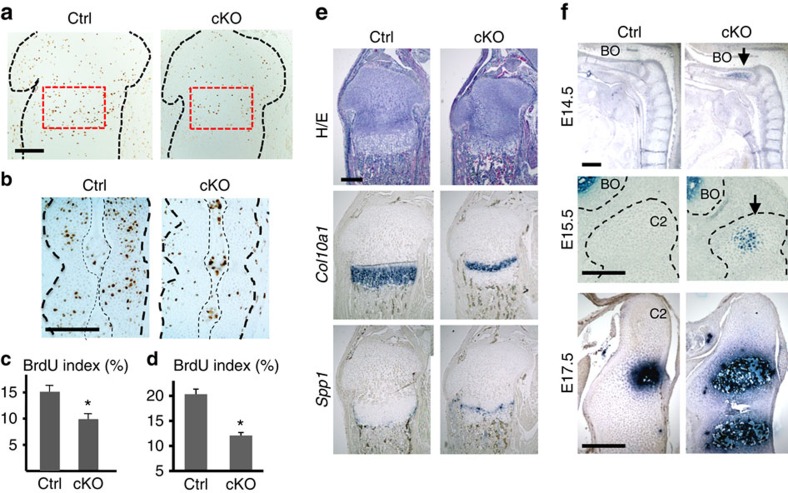
Figure 2. Proliferation and differentiation defects in Eed-deficient chondrocytes.
(a,c) BrdU incorporation is significantly reduced in growth plate chondrocytes of Eed cKO mice. Black dotted lines indicate the contour of the proximal epiphysis of tibiae. The BrdU labelling index in the proliferating zone, indicated by red-dotted lines, was counted in P 1.5-old littermate control and cKO mice. (b,d) BrdU incorporation is significantly reduced in the cartilage anlage of the cKO spinal primordium at E15.5. Thick black dotted lines indicate the contour of the spinal primordium at the level of C4 and C5. Thin dotted lines indicate the notochord. n=3; *P<0.05 versus Ctrl. (e) The Col10a1-expressing hypertrophic chondrocyte domain is reduced in the P1.5-old cKO tibial growth plate. An unresorbed hypertrophic chondrocyte layer beneath the Spp1 domain is occasionally present in cKO mice. (f) Sagittal sections of the spine show premature differentiation of Col10a-expressing hypertrophic chondrocytes (arrows) in cKO vertebral bones at indicated ages. BO, basi-occipital bone; C2, second cervical vertebra (axis). Scale bars, 200 μm.

