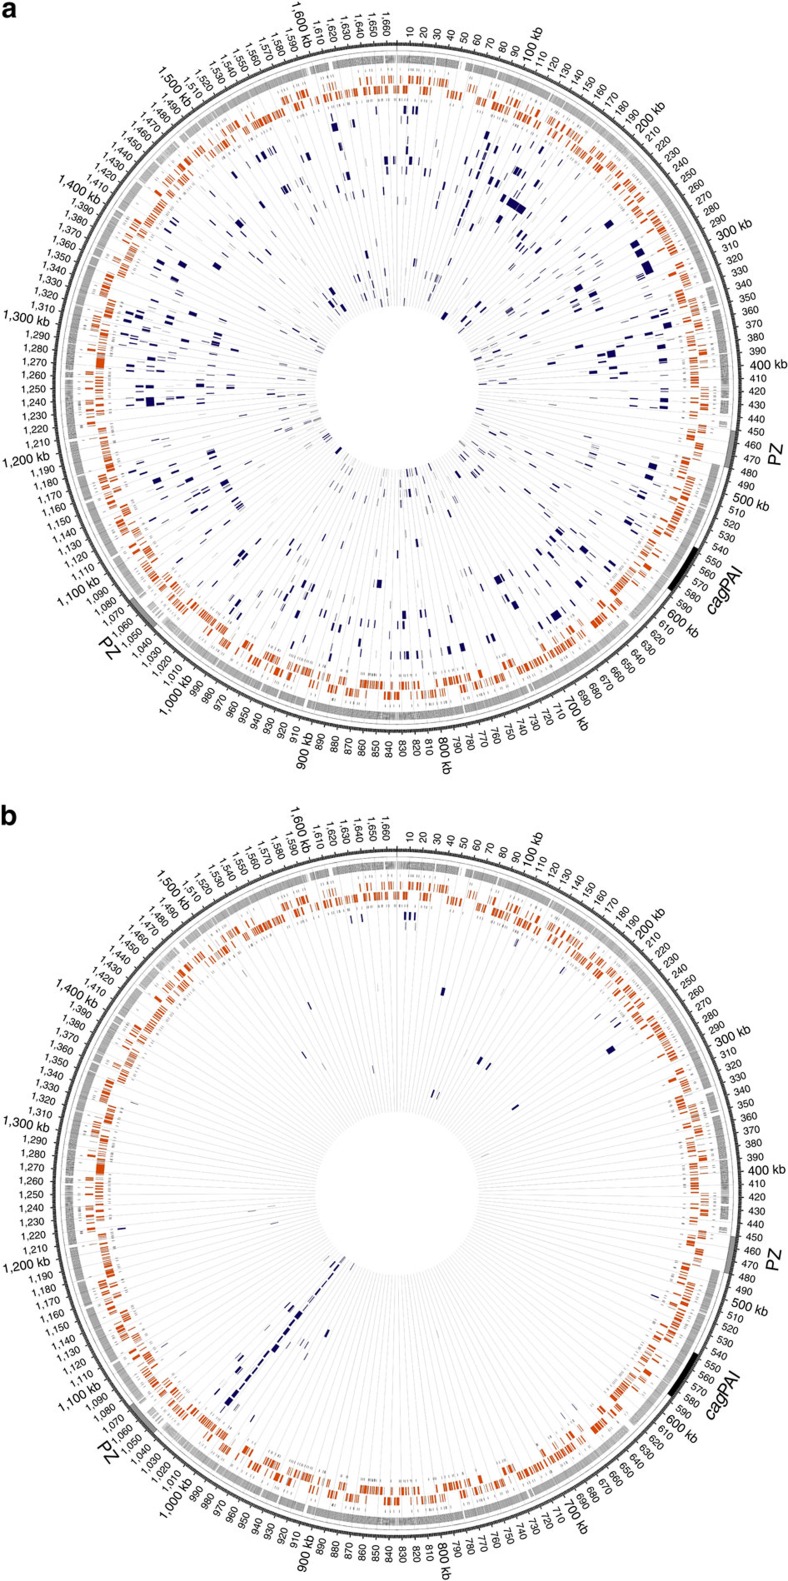
Figure 1. Circular representation of H. pylori 26695 recipient chromosome displaying SPIs and CNPs.
The representations, generated using Circos49, display clusters of nucleotide polymorphisms (CNPs)/single-polymorphism imports (SPIs) in the genomes of recombinant clones obtained from the transformation cycle (a) and short-term transformation (b) experiments. Circles from outwards to inwards depict localization of plasticity zone (grey) and cag pathogenicity island (cagPAI), positions of sequence differences between donor strain and strain 26695, transcription-start sites on plus strand, ORFs on plus strand (orange), ORFs on minus strand (orange), transcription-start sites on minus strand and a variable number of genomes of transformed clones indicating the positions of imports. Grid marks distance of 10 kb. (a) Imports of 20 TC clones transformed with gDNA of J99-R3Cm deriving from a total of four independent cultures (dark blue). (b) Imports of 21 STT clones transformed with gDNA of J99-R3Cm deriving from a total of two independent cultures (dark blue). Position at ∼1,015 kb marks site of selected recombination (rdxA::CAT allele).

