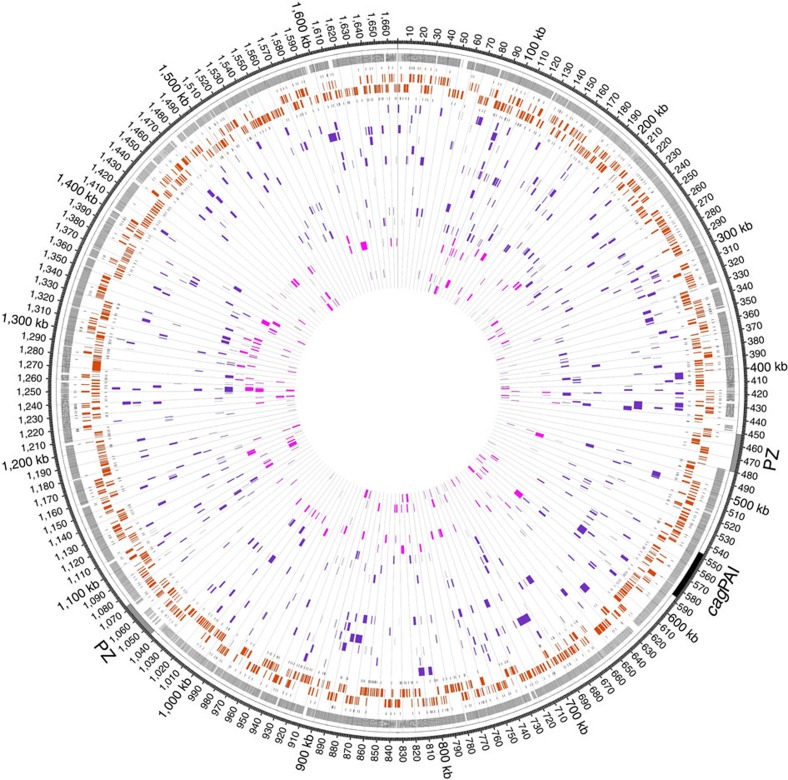
Figure 4. CNPs/SPIs in transformed clones obtained from the TC experiments with donor gDNAs of two different MTase-deficient mutants.
Circles from outwards to inwards depict the localization of plasticity zone (grey) and cag pathogenicity island (cagPAI), positions of sequence differences between donor strain and strain 26695, transcription-start sites on plus strand, ORFs on plus strand (orange), ORFs on minus strand (orange), transcription-start sites on minus strand and a variable number of genomes of transformed clones indicating the positions of imports. Figure depicts imports of 12 TC clones deriving from 2 independent cultures transformed with gDNA of J99-R3ΔGATC (purple) and imports of 6 TC clones deriving from 1 culture transformed with gDNA of J99-R3ΔGANTC (light purple). Grid marks distance of 10 kb.

