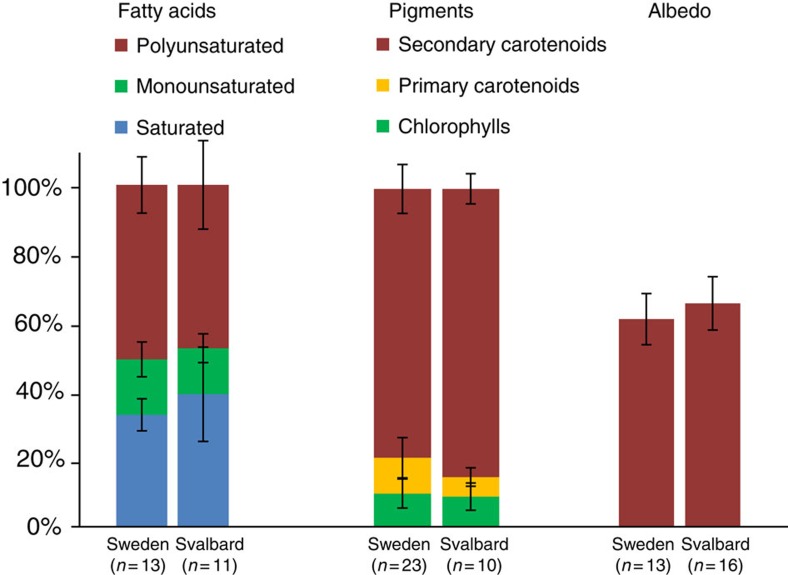
Figure 3. Algal fatty acid and pigment composition and albedo values.
Comparison between average fatty acid and pigment compositions with average surface albedo (all in % of total) for all Svalbard and Northern Sweden sites. Error bars are standard deviations (for full details see Supplementary Tables 1, 3 and 10).

