Fig. 3.

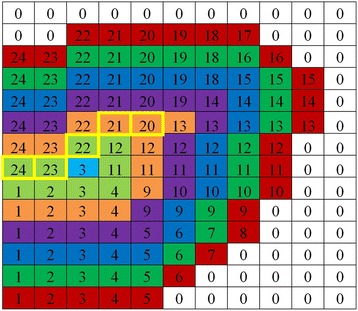
An illustration of the centerline is obtained through the AFMM. Each color represents a transmission process of the value of U and the yellow cell indicates the obtained regional centerline when T u = 7

An illustration of the centerline is obtained through the AFMM. Each color represents a transmission process of the value of U and the yellow cell indicates the obtained regional centerline when T u = 7