
Fig. 6.
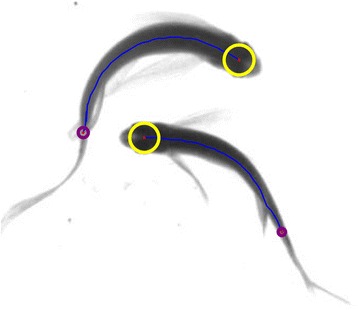
An illustration of the endpoint width of the centerlines. The yellow circles represent the width of fish head endpoints while the purple circles represent the width of fish tail endpoints. Since the fish head width is bigger than fish tail width, the head endpoints can be determined effectively through threshold