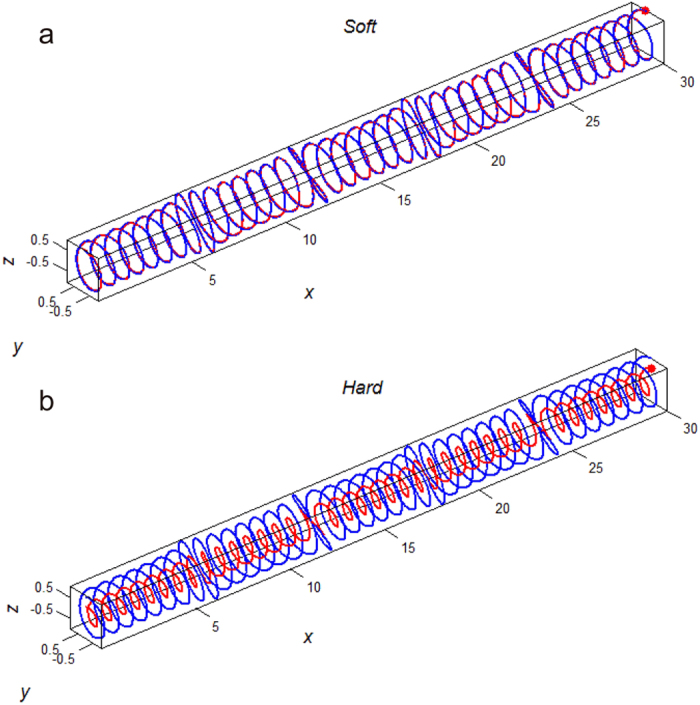
Figure 3. 3D scheme of numerical experiments.

Two extreme cases of the male flagellum stiffness are presented. (a) continuously soft. (b) continuously hard. The central axis of the female duct is shown by the blue line, the male flagellum is shown by the red line. The entire flagellum is inserted in the female spermathecal duct.
