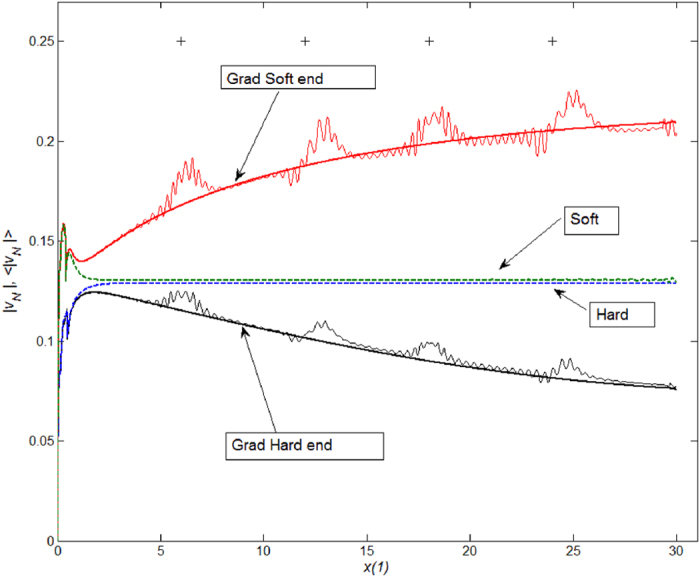
Figure 6. Correlation between maxima in the velocity of male flagellum tip along the female channel coordinate x(1) and the locations of the knots (shown with cross symbols “+”).

The curves corresponding to male flagella with stiffness gradient and female channels with four knots are oscillating lines. The curves corresponding to flagella with stiffness gradient and channels without knots are shown as thick lines. Finally, the curves corresponding to flagella without stiffness gradient and female channels without knots are shown as dashed lines. The tip velocity curves are averaged over moving time window with the width corresponding to the time interval between neighboring minima.
