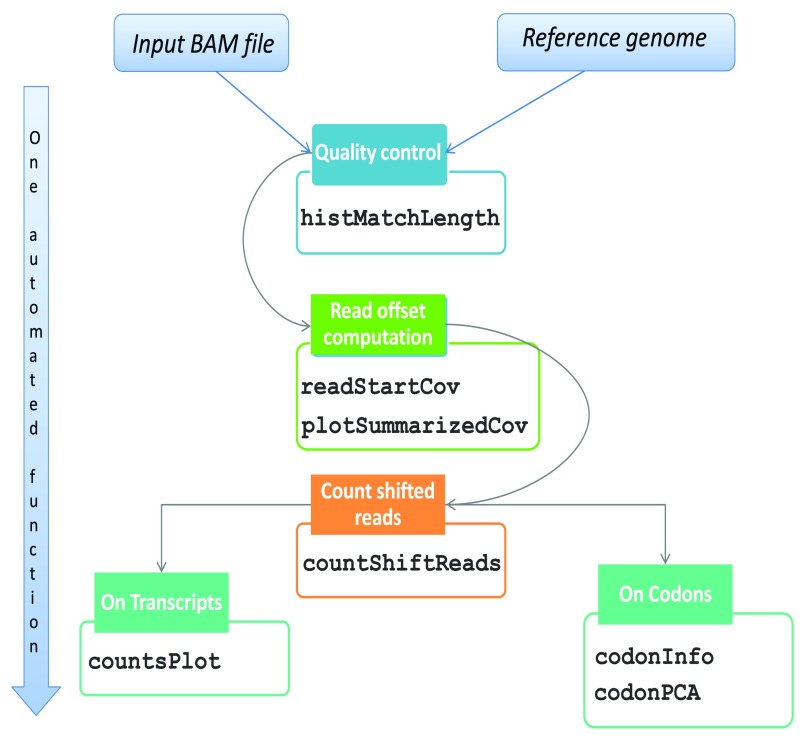
Figure 1. Workflow of ‘RiboProfiling’ Ribo-seq analysis from BAM to quantification on genomic features and codon motifs.
A second particularity in the handling of Ribo-seq data comes from the shift existing between the extremities of the read (i.e. 5’ or 3’) and the P-site position of the ribosome. Our package allows the identification of an offset from the 5’ end of the read, but also from the 3’ end. The function ‘readStartCov’ computes the read frequency distribution centered on the translation start site (TSS) of the most expressed protein coding transcripts (by default the 3% most expressed). Based on this frequency distribution, the ‘plotSummarizedCov’ function enables the visual quantification of the offset between the reads and the ribosome P-site ( Figure 2.B). In our Ribo-seq example, the 5’ read end is shifted 13 bp from the TSS. The innovation of this feature consists in the visualization of read lengths independently and as a summary figure.

