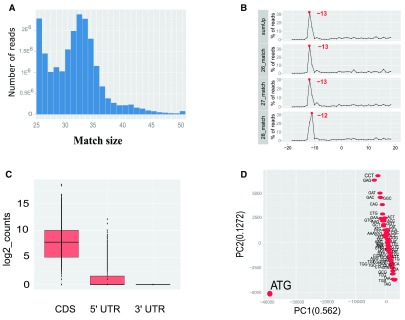
Figure 2. Graphical output of ‘RiboProfiling’ package on the GSM1655059 dataset.
A, Histogram of read length distribution with ‘histMatchLength’ function. B, Frequency of reads around the TSS for reads sizes 26 to 28; this graph points to an offset of 13 bp between the read 5’ end and the ribosome P-site. C, Boxplots of Ribo-seq read coverage on the CDS, 5’ UTR and 3’ UTR regions of protein coding genes. D. PCA analysis of Ribo-seq coverage on codons.

