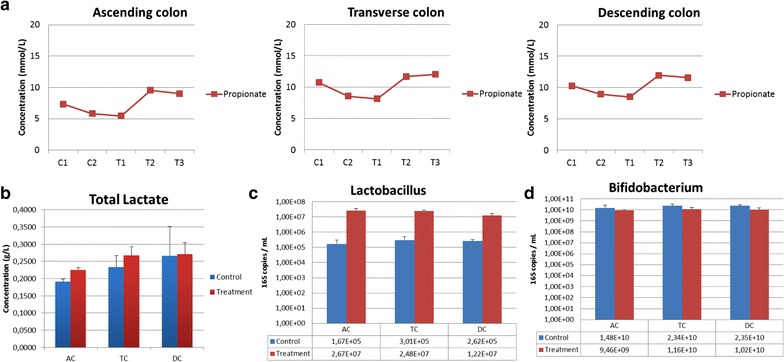
Fig. 2.

Analysis of DBR in the Shime® model. a Propionate production in the ascending and transverse colon in DBR-supplemented vessels (treatment weeks T1, T2 and T3) vs. control vessels (C1 and C2). b Total lactate concentrations (g/L) in DBR supplemented treatment vessels vs. controls. c, d Quantitative PCR results for the total copies/mL of lactobacilli (c) and bifidobacteria (d)
