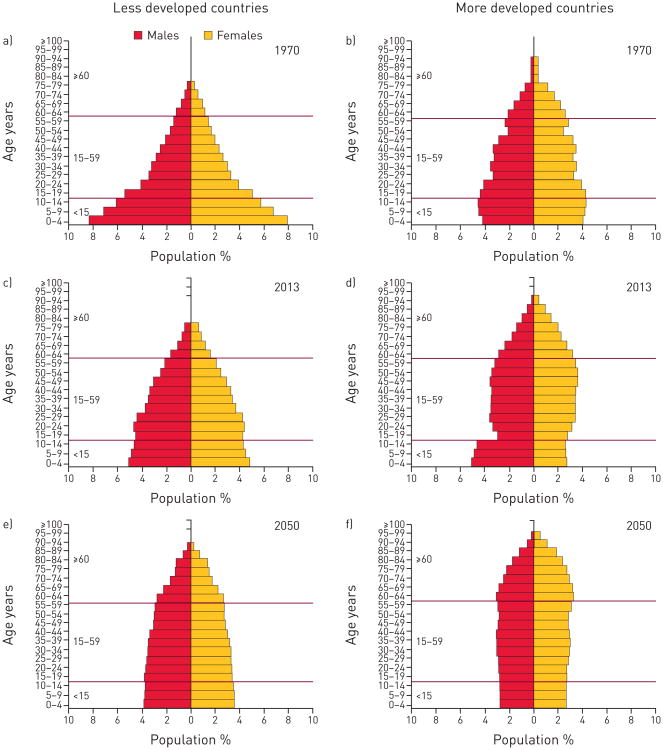
Figure 3.
The ageing pyramid is a graphic representation of population composition changes between a, b) 1970, c, d) 2013 and e, f) 2050 projection, stratified by less (a, c, and e) and more developed regions (b, d and f), sex, and age strata. Reproduced from [4] with permission from the publisher.

