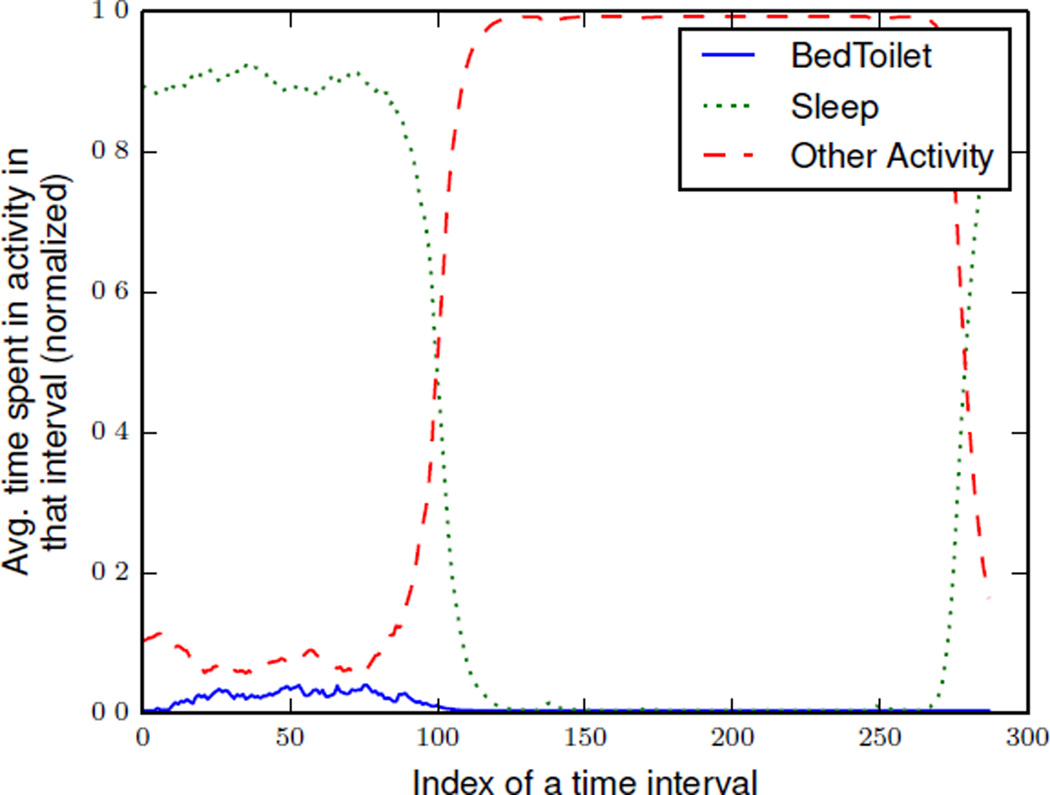
Figure 2.
An example aggregated activity curve that models three different activities: sleep, bed toilet transition, and an “other” activity. This sample aggregated activity curve was derived using x= three months of actual smart home data. Aggregated activity distributions were calculated at 5 minute time intervals, (m = 288). In this graph, the time interval at index 0 represents 12:00 AM.

