Figure 1.
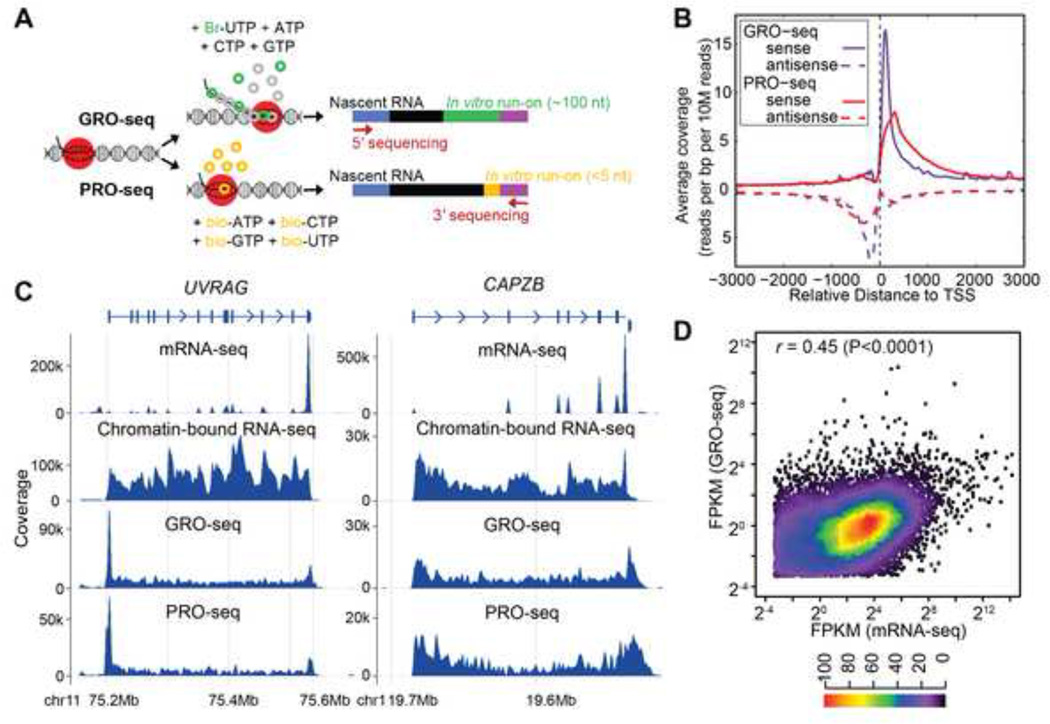
GRO-seq and PRO-seq analysis. (A) Schematic of GRO-seq and PROseq. (B) Comparison between GRO-seq and PRO-seq. Sense and antisense transcripts associated with transcription start sites (TSS) are shown for GRO-seq and PRO-seq samples. The slight shift of the PRO-seq promoter-proximal peak downstream relative to the GRO-seq peak is because the PRO-seq reads that were less than 35 nucleotides were not mapped in the analysis, and because GRO-seq maps 5’ ends and PRO-seq maps 3’ ends of nascent RNAs. (C) mRNA-seq, chromatin-bound nascent RNA-seq, GRO-seq and PRO-seq results for two representative genes, UVRAG and CAPZB. For genes with proximal Pol II pausing such as UVRAG, there are more reads mapping to the 5’ ends of genes in both GRO-seq and PRO-seq samples. Schematic gene structure is aligned to mRNA-seq results, with boxes representing exons, lines representing introns and arrowheads showing direction of transcription. Coverage is calculated using bin size of ~ 1500 bp and 600 bp, respectively. (D) Scatter plot of gene expression levels from GRO-seq and mRNA-seq (FPKM>0.1). Results from GM12750 (shown) and GM12004 are similar (r=0.45 for both samples). Heatmap indicates frequency of different expression levels.

