
Fig. 2.
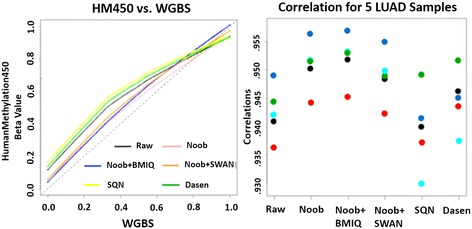
Cross-platform comparison of Beta values from HumanMethylation450 vs whole-genome bisulfite sequencing. a For 1 LUAD sample, loess curve fitted to 199441 paired Beta values for WGBS and HM450 data after different processing methods. The dashed line indicates equal values, b Scatter plot of correlations between WGBS Beta values and HM450 Beta values after different processing methods in 5 LUAD samples. Different colors represent different samples. Aqua shows the results from the sample in a)