Figure 3.
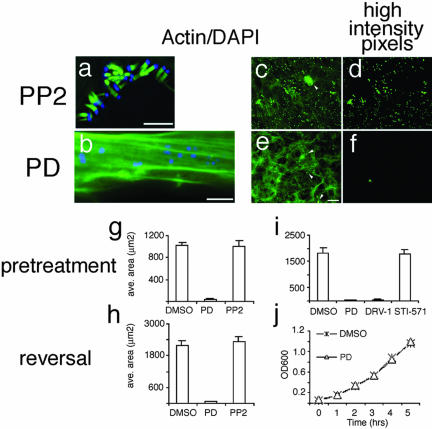
Formation and maintenance of EPEC pedestals is blocked by PD166326 and related kinase inhibitors. (a and b) Images of 3T3 cells treated with Src kinase inhibitor PP2 (25 μM; a) or with PD166326 (10 μM; b) and then infected with EPEC for 6 h. Cells were stained with DAPI to recognize bacteria (blue) and FITC-phalloidin to recognize actin (green). (c–f) Representative images taken with 20× objective from cells pretreated with 10 μM PP2 (c) or 10 μM PD 166326 (e) and infected with EPEC. Cells were stained with FITC-phalloidin (green) to recognize actin, and DAPI (our unpublished data) and quantitated (see MATERIALS AND METHODS). Spatial distribution of the highest intensity pixels are exemplified in d for PP2 and f for PD and correspond to the actin pedestals in c and e. Arrowheads denote high-intensity pixels that did not correspond to pedestals and were excluded from the analysis. (g–i) Area occupied by the highest intensity pixels for EPEC treated according to the pretreatment (g and i) or reversal (h) regimens with DMSO, 10 μM PD166326, or 10 μM PP2. For i, PD analogs (SKI-DV-1-10 [DRV-1]; 10 μM) blocked EPEC pedestal formation but STI-571 (25 μM) did not. (j) Growth of EPEC was unaffected by treatment with PD166326. EPEC were cultured with either 0.1% DMSO (X) or 25 μM PD (Δ) and the OD 600 measured at the times indicated. Bar, 5 μm (a and b). Bar in e represents 40 μm and applies to c, d, and f as well.

