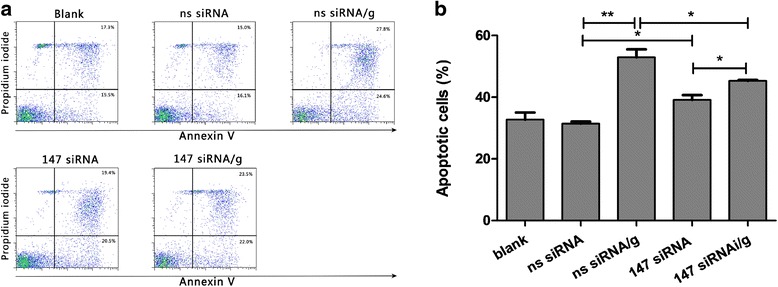
Fig. 8.

a Analysis of PBMC apoptosis by flow cytometry. Apoptosis of PBMC was determined by staining with annexin V and PI followed by flow cytometric analysis. The percentages of cells with different staining patterns are shown. The results presented here are representative of three independent experiments. b rHco-gal-m affected the apoptosis of goat PBMC by the interaction with TMEM147. The percentage of apoptosis was measured on four separate occasions. Results presented here are representative of three independent experiments. Data are presented as the mean ± SD (n = 3); an asterisk and a capped line designate two groups that differ significantly (P < 0.01); double asterisk and a capped line designates two groups that differ highly significantly (P < 0.001)
