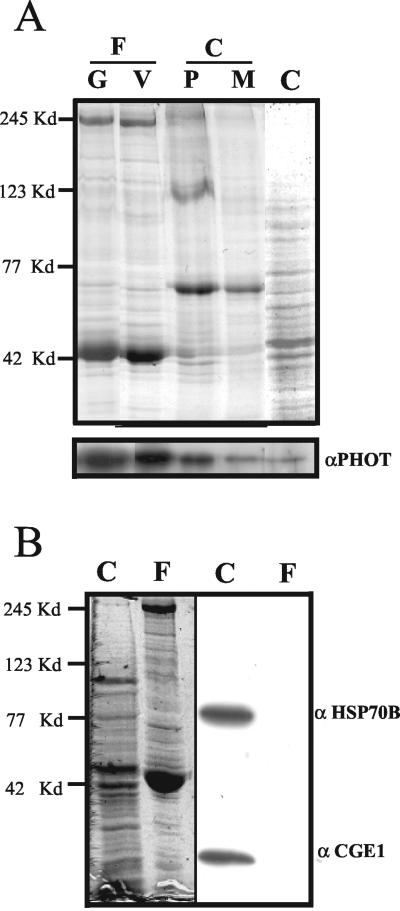
Figure 1.
Protein blot to demonstrate the presence of phototropin in flagella. (A) Flagella (F) were released from the cells by the pH shock method. The plasma membrane (P) of the cell bodies (C) was isolated using a two-phase partitioning method, and the microsomal membrane (M) was isolated by differential centrifugation as described in MATERIALS AND METHODS. Flagellar protein (8 μg) from gametes (80% mating competent cells) (G) or vegetative cells (V), and the same amount of protein from cell bodies as well as the plasma membrane fraction (P) and the microsomal membrane fraction (M) of the cell bodies were separated by SDS-PAGE. Top, Coomassie Blue-stained gel. Phototropin was detected by Western blot analysis (bottom) by using an antibody raised against the kinase domain of Chlamydomonas phototropin (Huang et al., 2002). (B) Purity of the flagella fraction was assessed using antibodies directed against proteins HSP70B and CGE1 of the chloroplast (right side). Left side of B shows the gel stained with Coomassie Blue. Protein (40 μg) from cell bodies (C) and flagella (F) were applied per lane. The positions of marker proteins are shown on the left side.

