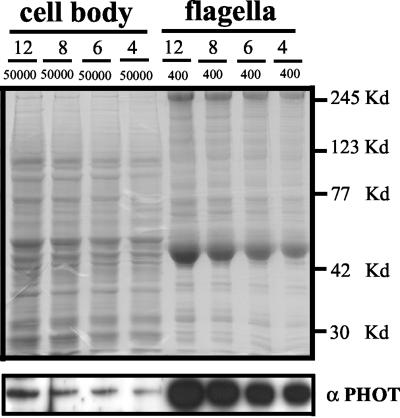
Figure 3.
Determination of the relative amounts of phototropin in flagella and cell bodies. From a Chlamydomonas culture (strain CC-124), the flagella were separated from the cell bodies by the pH shock method. Flagella and cell bodies were resuspended in 0.4 and 50 ml of sample buffer, respectively, and homogenized (see MATERIALS AND METHODS). Different volumes (12, 8, 6, and 4 μl) of flagella and cell body proteins were separated by SDS-PAGE and analyzed by Western blot (bottom). Quantification of the relative amounts of phototropin was achieved using the quantification method described in MATERIALS AND METHODS. The relative amount of phototropin localized in the flagella was calculated according to the formula 400/50000 × 4.8 = 3.84 (the relative amount of phototropin in the flagella samples was determined to be 4.8-fold higher than that in the cell body samples of the same volume). Top, gel stained with Coomassie Blue. The positions of marker proteins are shown on the right side.

