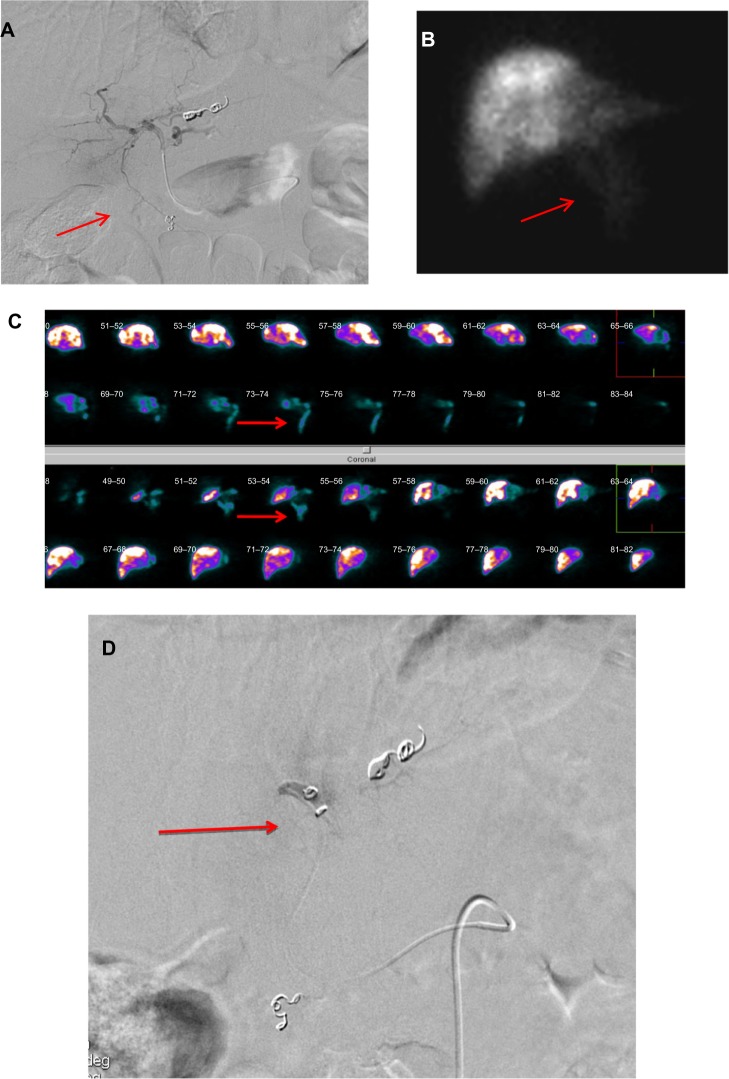
Figure 1.
(A–D) The pretreatment angiogram.
Notes: (A) The hepatofugal flow through a small falciform artery (arrow). (B) The 99mTc-MAA and (C) the SPECT images confirmed the extrahepatic distribution of the microspheres (arrows). (D) The falciform artery was superselectively catheterized and embolized with coils (arrow).
Abbreviations: 99mTc-MAA, 99mTc labeled macroaggregated albumin; SPECT, single photon emission computed tomography.

