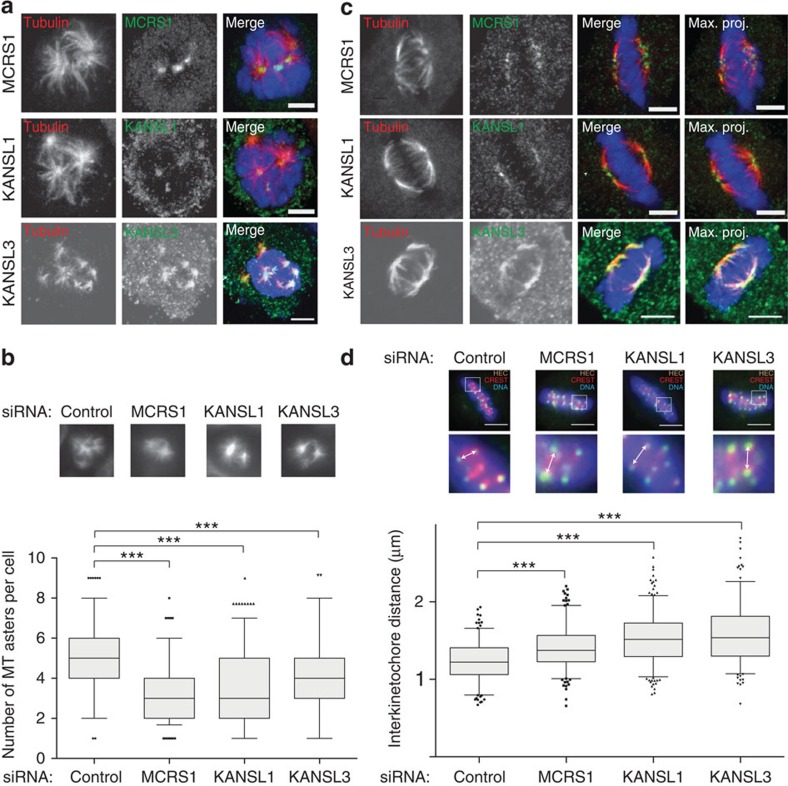
Figure 3. KANSL1 and KANSL3 are required for chromosomal microtubule assembly and K-fibre stabilization.
(a) KANSL1 and KANSL3 localization to chromosomal microtubule asters. Immunofluorescence images of mitotic HeLa cells fixed 5 min after nocodazole washout. Tubulin is shown in red; MCRS1, KANSL1 and KANSL3 in green; and DNA in blue. KANSL1, KANSL3 and MCRS1 localize to the centre of microtubule asters. Scale bars, 5 μm. (b) KANSL1 and KANSL3 phenotypes in microtubule regrowth assay. Top: representative immunofluorescence images of microtubule asters in cells fixed 5 min after nocodazole washout. Bottom: number of microtubule asters. Box and whisker plot: boxes show the upper and lower quartile, whiskers extend from the 10th to the 90th percentile and dots correspond to outliers. n=3. MCRS1-, KANSL1- and KANSL3-silenced cells had on average a lower number of microtubule asters (3,429; 3,457 and 4,048, respectively), than control cells (4,996). More than 260 cells were analysed for each condition. ***P=0.0001 (unpaired t-test). (c) KANSL1 and KANSL3 localization to K-fibres. Cold-treated cells were fixed and stained with anti-tubulin (red) and anti-MCRS1, anti-KANSL1 or anti-KANSL3 (green) antibodies. DNA is in blue. Single confocal slices are shown except for the images on the right that correspond as indicated to maximum projections of 12 slices. KANSL1, KANSL3 and MCRS1 localize to the minus ends of K-fibres in mitosis. Scale bar, 5 μm. (d) Interkinetochore distance. Control, MCRS1-, KANSL1- and KANSL3-silenced HeLa cells were fixed and stained for the outer-kinetochore marker Hec1 (green) and CREST (red). The white arrows show paired sister kinetochores. The plot shows the interkinetochore distances in three independent experiments. Box and whisker plot: boxes show the upper and lower quartile, whiskers extend from the 10th to the 90th percentile and dots correspond to outliers. In MCRS1-, KANSL1- and KANSL3-silenced cells, the average interkinetochore distance is significantly increased (1,415; 1,504; 1,566 μm, respectively, versus 1,25 μm for the control cells). At least 221 kinetochores have been measured in each condition. Scale bar, 5 μm. ***P=0,0001 (unpaired t-test).

