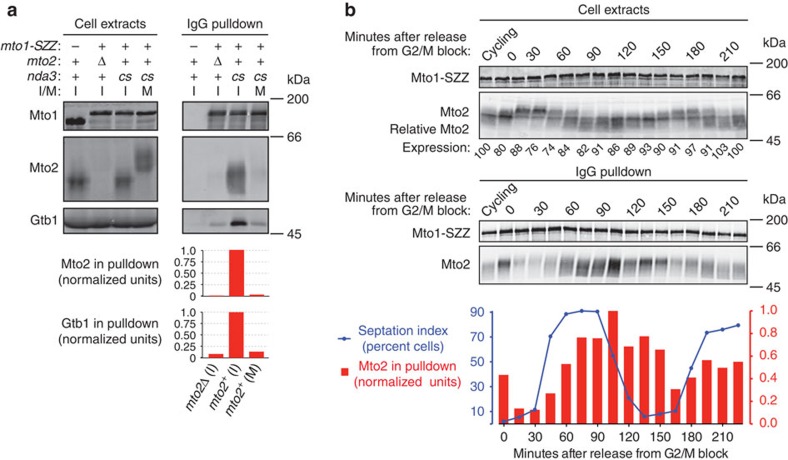
Figure 2. Mitotic Mto2 hyperphosphorylation coincides with disruption of Mto1–Mto2 interaction.
(a) Anti-Mto1, anti-Mto2 and Anti-Gtb1 (S. pombe γ-tubulin) western blots of cell extracts and IgG pulldowns from interphase and metaphase-arrested cells expressing Mto1-SZZ (Protein A tag). Graphs show quantification of Mto2 and Gtb1 copurifying with Mto1-SZZ in the pulldowns above, normalized to the values for mto2+ interphase cells (central column; see Methods). I, interphase; M, mitosis; cs, cold-sensitive nda3-KM311 β-tubulin allele, used for metaphase arrest. (b) Anti-Mto1 and anti-Mto2 western blots of cell extracts and corresponding IgG pulldowns from mto1-SZZ cdc25-22 cells undergoing two synchronous mitoses after release from G2/M arrest. Mto2 expression levels are relative to interphase cycling cells (first lane, set to 100; see Methods). Graph shows septation index (blue line) and quantification of Mto2 copurifying with Mto1-SZZ at each time point (red bars), normalized to the 105 min time point (see Methods). Note that second mitosis is not as synchronous as the first.

