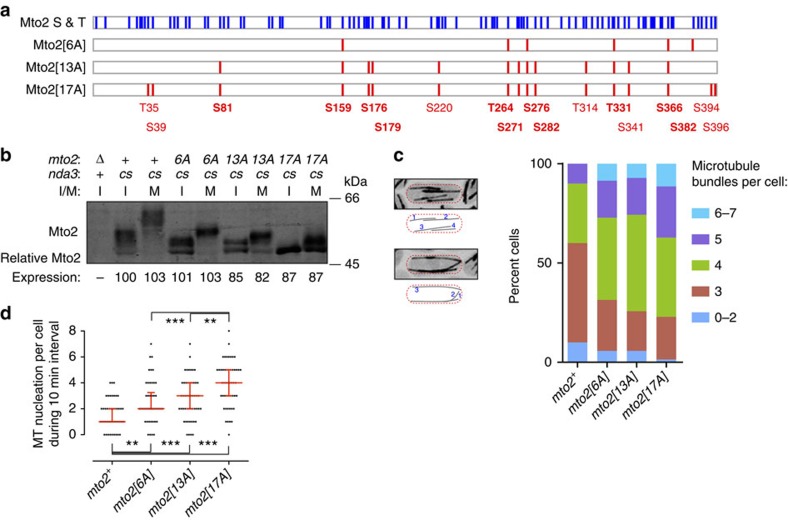
Figure 3. Phosphomutant Mto2 proteins are potent interphase microtubule nucleators in vivo.
(a) Schematic representation showing distribution of serine and threonine residues in wild-type Mto2 (blue, total 92 residues; 14 tyrosines residues are not shown), together with sites mutated in phosphomutant Mto2 proteins (red). Mutated sites that were experimentally identified as phosphorylated are indicated in bold (these are a subset of total identified phosphosites; see Supplementary Table 1). Mutated residues are also shown in Supplementary Fig. 2. (b) Anti-Mto2 western blot showing altered Mto2 mobility on SDS–PAGE in mto2-phosphomutant cells. Mto2 expression levels are relative to interphase mto2+ cells (second lane, set to 100; see Methods). I, interphase; M, mitosis; cs, cold-sensitive nda3-KM311 β-tubulin allele, used for metaphase arrest. (c) Quantification of microtubule bundle number per cell in the strains indicated, expressing GFP-tubulin. Images and cartoons at left indicate method of quantification. 70 cells were scored for each strain. P-values (Wilcoxon rank-sum test): mto2+ versus mto2-phosphomutant cells, P<1e-3. (d) Quantification of microtubule nucleation events per cell during a 10 min interval in the strains indicated, expressing GFP-tubulin. Fifty cells were scored for each strain. Median with interquartile range is shown in red. **P<1e-3, ***P<1e-4 (Wilcoxon rank-sum test). See also Supplementary Movie 2.

