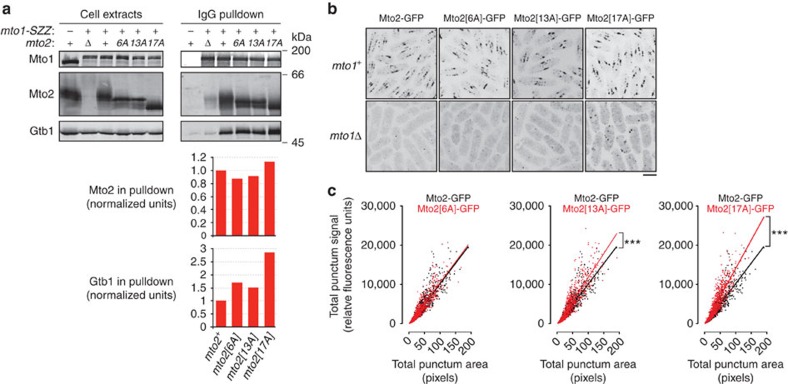
Figure 4. Mto1/2 complex containing phosphomutant Mto2 for ms more robust puncta in vivo.
(a) Anti-Mto1, anti-Mto2 and Anti-Gtb1 Western blots of interphase cell extracts and corresponding IgG pulldowns from cells expressing Mto1-SZZ. Graphs show quantification of Mto2 and Gtb1 copurifying with Mto1-SZZ in the pulldowns above, normalized to the values for mto2+ cells (first column; see Methods). (b) Localization of wild-type and phosphomutant Mto2-GFP in mto1+ and mto1Δ cells. Z-projections. Note in particular the increased fluorescent signal of Mto2[17A]-GFP puncta in mto1Δ cells. (c) Quantification of fluorescent signals of wild-type and phosphomutant Mto2-GFP puncta, based on images similar to upper panels in (b). Best-fit linear regression indicates fluorescent signal per pixel of punctum area, which is related to number of Mto2-GFP molecules per (sub-resolution) volume within the puncta. ***P<1e-9 (Wilcoxon rank-sum test). Scale bar, 5 μm.

