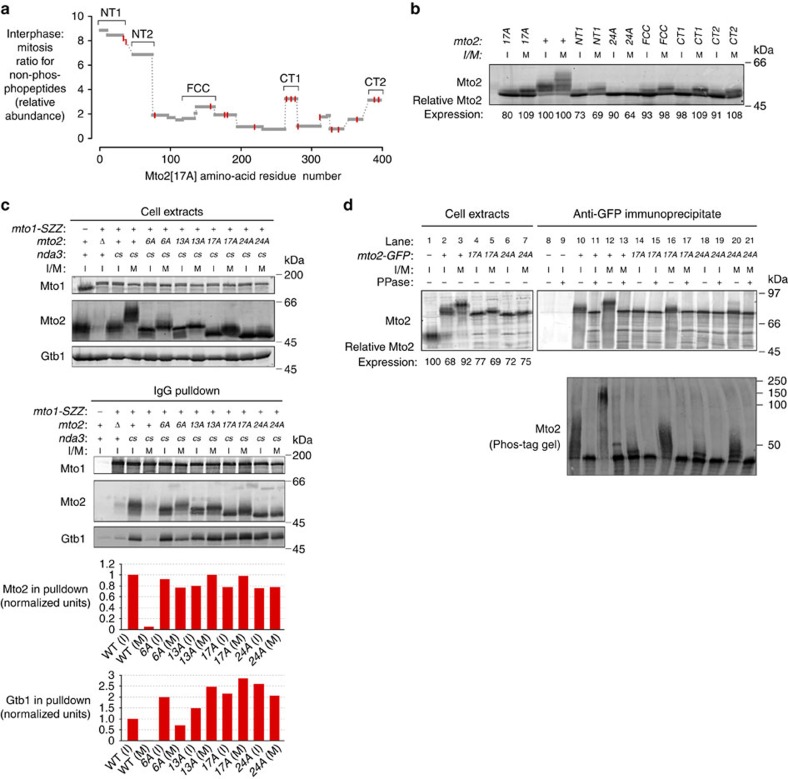
Figure 5. Mto2 phosphomutants can maintain Mto1–Mto2 and Mto1/2-γ-TuC interactions in mitosis.
(a) Abundance ratios of Mto2[17A] non-phosphopeptides in interphase versus mitosis, as measured by SILAC mass spectrometry, indicating that several Mto2[17A] regions undergo high-stoichiometry modifications during mitosis. Grey bars indicate quantified peptides. Red lines indicate position of residues already mutated in Mto2[17A] (see Fig. 3a). Brackets indicate regions containing additional phosphosite mutations in the second-generation series of mto2-phosphomutant cells shown in (b). (b) Anti-Mto2 western blot of extracts from mto2[17A], wild-type (mto2+) and second-generation mto2-phosphomutant cells, containing additional phosphosite mutations beyond those in mto2[17A]. Second-generation phosphomutants are named according to the region containing additional mutations, with the exception of the mutant corresponding to NT2, which is named mto2[24A]. Mto2 expression levels are relative to interphase mto2+ cells (third lane, set to 100; see Methods). Cold-sensitive nda3-KM311 β-tubulin allele was used to arrest cells in metaphase. I, interphase; M, mitosis. (c) Anti-Mto1, anti-Mto2 and Anti-Gtb1 western blots of cell extracts and corresponding IgG pulldowns, from interphase and metaphase-arrested wild-type and mto2-phosphomutant cells expressing Mto1-SZZ. Graphs show quantification of Mto2 (or phosphomutant Mto2) and Gtb1 copurifying with Mto1-SZZ in the pulldowns above, normalized to wild-type (WT) interphase cells (first column; see Methods). cs, cold-sensitive nda3-KM311 β-tubulin allele, used for metaphase arrest. (d) Anti-Mto2 Western blots of cell extracts and anti-GFP immunoprecipitates from untagged (mto2+), mto2-GFP, mto2[17A]-GFP and mto2[24A]-GFP cells; immunoprecipitates were either treated with lambda phosphatase (PPase, +) or untreated (−). Upper panels show proteins resolved on 10% Laemmli SDS–PAGE. Mto2-GFP expression levels are relative to cells expressing untagged Mto2 (Lane 1, set to 100; see Methods). Lower panel shows proteins resolved on 6% Phos-tag SDS–PAGE; because protein migration on Phos-tag gels is strongly affected by phosphorylation state, molecular weight markers here are only fiducial. Aspect ratio in lower panel was altered relative to original image, to match width of upper panel. All mto2-GFP strains are also nda3-KM311.

