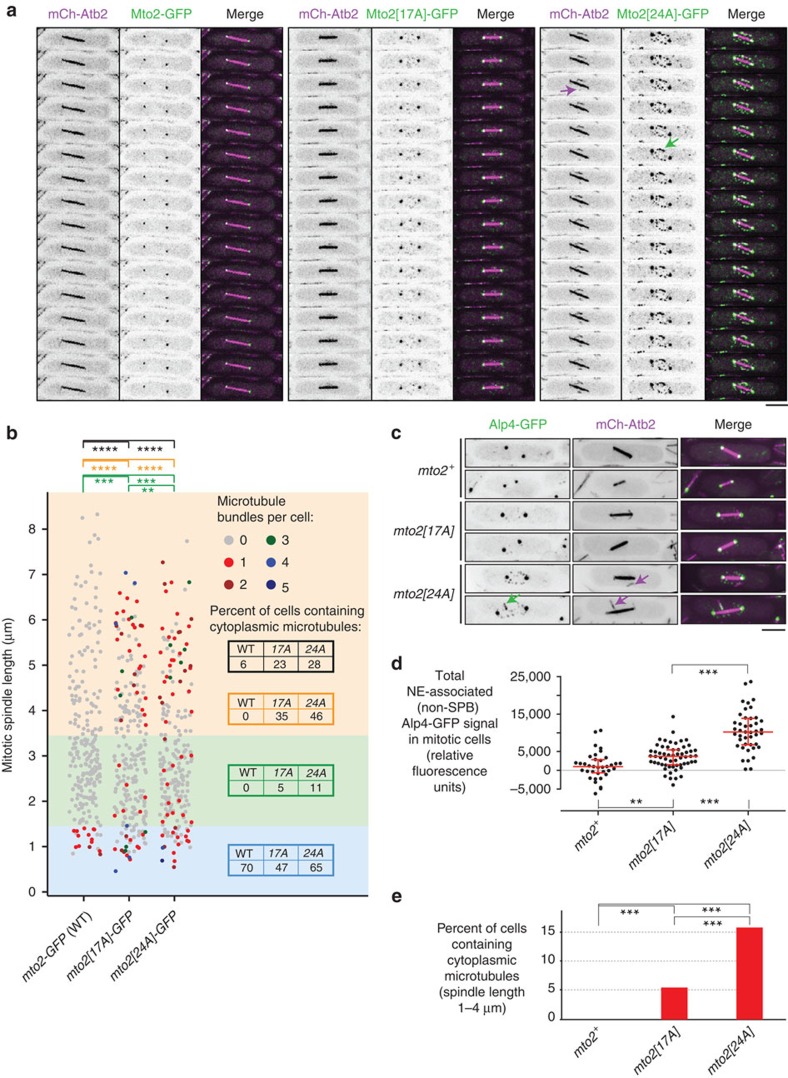
Figure 7. Mto2[24A] promotes interphase-like microtubule nucleation in mitosis.
(a) Time-lapse images (1.6 s interval) of wild-type and phosphomutant Mto2-GFP in mitosis, co-imaged with mCherry-tubulin (mCh-Atb2). Magenta arrow indicates cytoplasmic microtubule (MT) nucleation event; green arrow indicates Mto2[24A]-GFP localized to MT. See Supplementary Movie 3 for corresponding movie. (b) Quantification of cytoplasmic MTs (mCherry-tubulin) in mitotic wild-type mto2-GFP (WT) and phosphomutant mto2[17A]-GFP and mto2[24A]-GFP cells (n=240, 244 and 228 cells, respectively). Data set was divided into three bins based on mitotic spindle length, roughly corresponding to prometaphase, metaphase and early-to-mid anaphase (blue, green and orange shading, respectively). Coloured tables in each bin show percent of mitotic cells within that bin containing one or more cytoplasmic MTs, for each genotype. Table in black shows this for all three bins combined. Statistical significance analyses were performed separately for each bin and are presented in corresponding colours. **P<0.05, ***P<0.01, ****P<1e-7 (Wilcoxon rank-sum test, one tailed). (c) Mitotic localization of γ-TuSC protein Alp4 fused to GFP (Alp4-GFP), together with mCherry-tubulin (mCh-Atb2), in wild-type and mto2-phosphomutant cells, as indicated. Note localization of Alp4-GFP to the nuclear envelope (NE) in mto2[24A] cells, and weaker localization to NE in mto2[17A] cells. Magenta arrows indicate cytoplasmic MTs; green arrow indicates Alp4-GFP localized to cytoplasmic MT. (d) Quantification of total fluorescence signal of Alp4-GFP at the NE in mitotic wild-type and mto2-phosphomutant cells, as indicated (n=36, 58 and 43 cells, respectively). Fluorescence signal at SPBs was excluded from analysis (see Methods). Median with interquartile range is shown in red. **P<1e-3, ***P<1e-9 (Wilcoxon rank-sum test, two-tailed). (e) Quantification of cytoplasmic MTs in mitosis in wild-type and mto2-phosphomutant cells expressing Alp4-GFP and mCherry-tubulin. Percent of cells containing one or more cytoplasmic MTs is shown, for cells with spindle lengths between 1 and 4 μm (n=126, 138 and 118 cells, respectively). ***P<0.01 (Fisher's exact test, two-tailed). All images are Z-projections; individual Z-sections show NE-associated Mto1/2 complex on the NE and not in nuclear interior. Scale bars, 5 μm.

