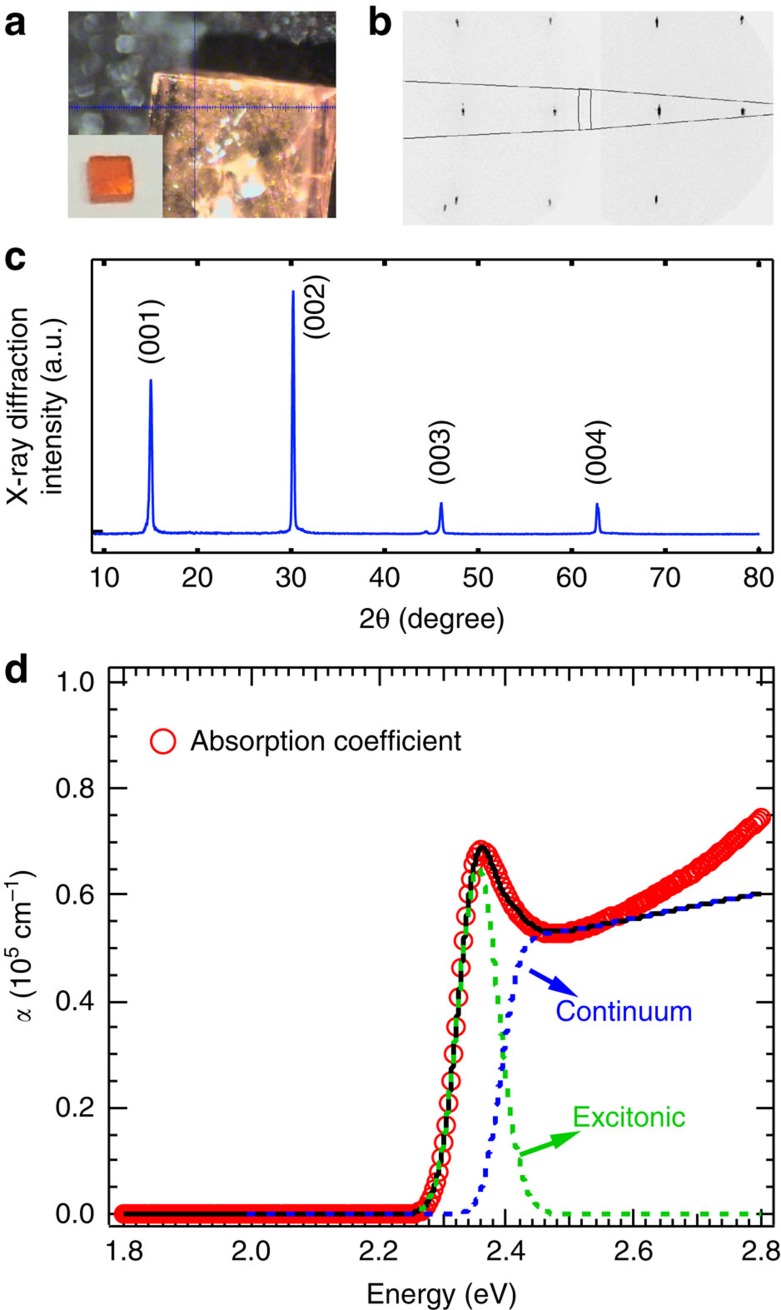
Figure 1. Structure characterization and optical absorption spectrum.
(a) The microscopic image of the single crystal. The cross-hair indicates that the X-ray beam is located at the front face. Inset is the photograph of the single crystal. (b) X-ray diffraction pattern measured by two-dimensional area detector. The right and left frame are corresponding to 2θ centred at 30 and 60°, respectively. (c) Integration of the X-ray diffraction pattern. The diffraction intensity is integrated in the region of χ=90±5°, indicated by the black lines in panel b. χ is the angle between the plane determined by the incident and diffracted beams and the plane of the front face. (d) The absorption coefficient (red circles) of the CH3NH3PbBr3 perovskite single crystal obtained from ellipsometry measurement. The black-line is the modelled absorption coefficient with excitonic (green-dash line) and continuum (blue-dash line) components.

