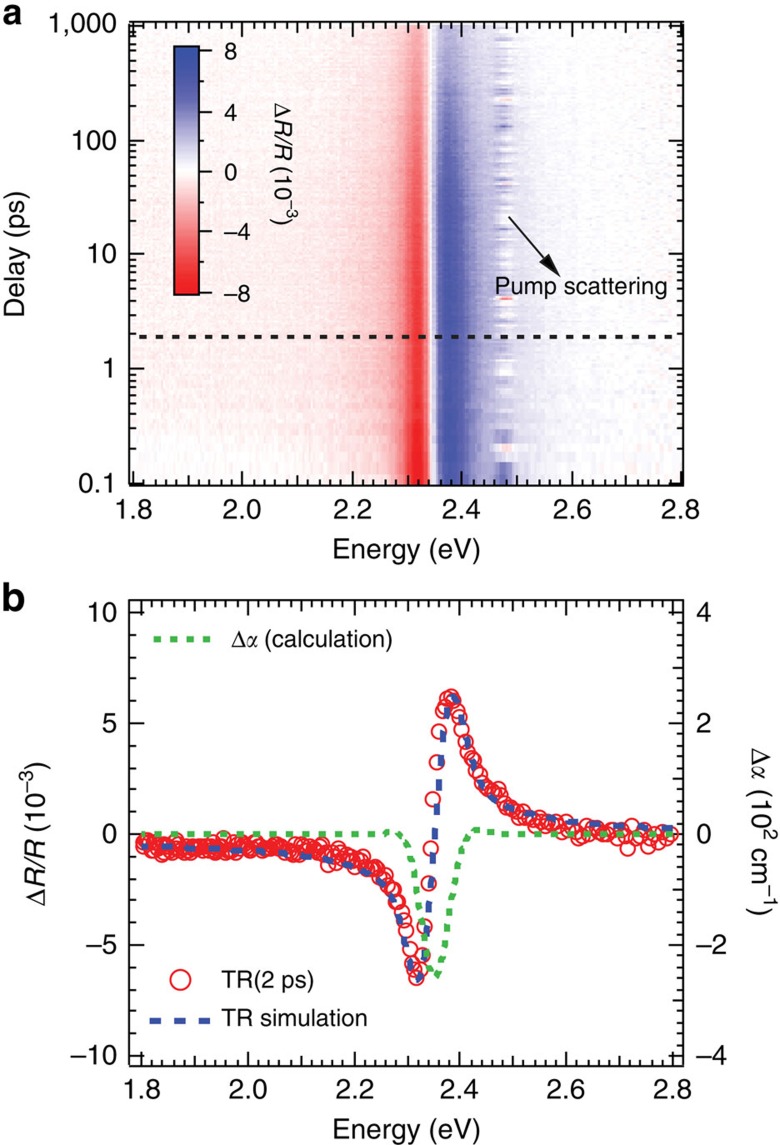
Figure 2. TR spectra and simulations.
(a) Pseudocolor representation of the transient reflectance spectra. (b) The transient reflection spectrum at delay time of 2 ps (dotted line in panel a) and the corresponding simulation (blue-dash line). The calculated change in absorption coefficient is shown as the green-dash line.

