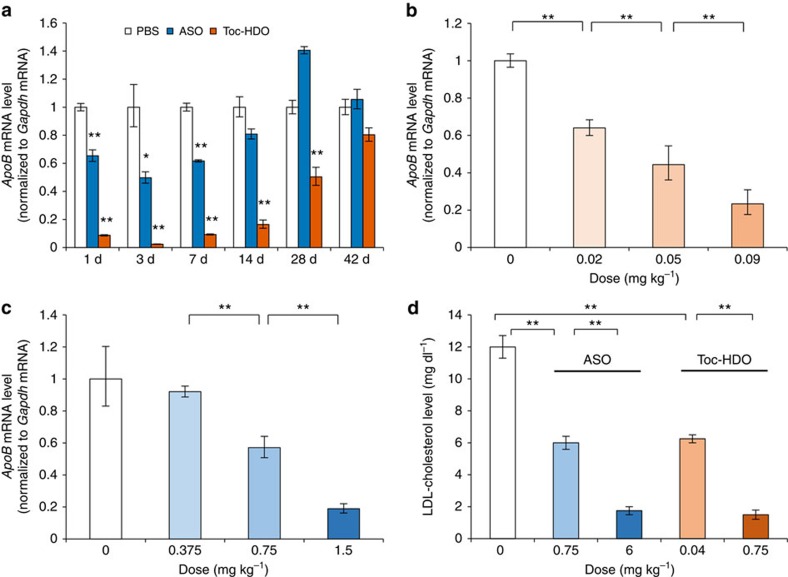
Figure 2. Duration of gene silencing and dose-dependent reduction by ASO and Toc-HDO-targeting ApoB mRNA.
(a) qRT–PCR analyses showing ApoB mRNA levels in liver assayed at the indicated time points after injection of 0.75 mg kg−1 ASO, Toc-HDO or PBS alone. Data are expressed as mean values±s.e.m. (n=3, *P<0.05, **P<0.01 versus PBS). (b,c) Dose-dependent reduction of gene silencing after injection of Toc-HDO (b) or ASO (c) (n=3, mean values±s.e.m., **P<0.01). (d) Serum LDL cholesterol levels 3 d after injection of ASO, Toc-HDO or PBS alone. Data are expressed as mean values±s.e.m. (n=3, **P<0.01 versus PBS). Data are representative of at least three independent experiments each. P values were calculated from the Student's two-tailed t-test (a) or the Jonckheere–Terpstra test (b–d).

